Introduction
Infrared astronomy started about three decades after infrared (IR) radiation was discovered by Sir William Herschel in 1800. Work in the IR range has been an important facet of astronomical investigation since the 1950s and 1960s, when technological advances in IR detectors began being leveraged to augment the success of contemporary radio astronomy. By the mid-1980s, array detectors engineered to provide photonic sensitivity in the near-infrared (NIR) range — at wavelengths between 700 and 3000 nm — were letting astronomers explore the universe in new and exciting ways.
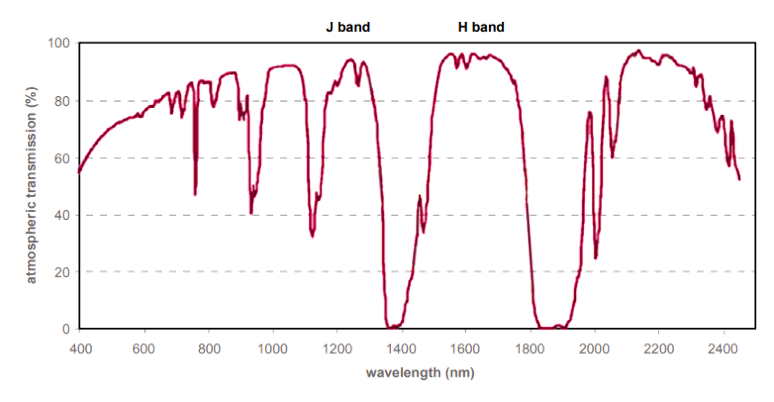
Since then, the development of InGaAs, InSb, and HgCdTe detectors has facilitated ground-based observations in the J and H astronomical bands of the NIR-II / short-wavelength infrared (SWIR) range extending from 1050 nm to beyond 1700 nm. The J and H bands, which are depicted in Figure 1, correspond to 1100–1400 nm and 1500–1800 nm, respectively.
These two astronomical bands are among several “infrared windows” (wavelengths) at which the Earth’s atmosphere is essentially transparent to infrared light. Although most infrared light is absorbed by water vapor in the Earth’s atmosphere, atmospheric transmission of light within the so-called infrared windows is much better.
To optimize ground-based observations, most IR-capable telescopes on the Earth’s surface are located in dry geographical regions and at rather extreme elevations that are higher than most of the water vapor in the atmosphere.
Today, infrared astronomy remains a critical subfield of astronomy, a fact underscored by a 2015 NRC report that recommends improvements in the US ground-based optical and infrared astronomy system so as to meet specific long-term scientific goals pertaining to astronomy, planetary science, and astrophysics [1].
The use of infrared radiation for astronomy is crucial because unlike light at visible wavelengths, infrared light is not blocked by interstellar dust. Ground-based observations via the “infrared windows” described above can therefore aid in the ongoing search for planets (such as M dwarfs) that may possess the potential to support life. Furthermore, for astrophysics investigations, the red-shifted light originating from objects in the early universe can only be detected within the IR spectral region.
J & H Band Applications
Over the past three decades, myriad investigations have relied upon ground-based observations in the J and H astronomical bands. In the 1990s, for instance, such observations helped astronomers produce a new grid of faint NIR standard stars as well as a secondary list of red stars suitable for determining color transformations between photometric systems [2].
At the dawn of the twenty-first century, the advent of silicon immersion grating technology coupled with adaptive optics at large ground-based telescopes started to revolutionize high-resolution infrared spectroscopy [3]. And earlier this decade, studies of integrated J- and H-band spectra of globular clusters in the LMC [4] as well as spectroscopic investigations of M dwarfs [5,6] using data collected from the J and H bands have been published.
Applications utilizing the J and H astronomical bands may also include ground-based observations of phenomena associated with planets in the Solar System, such as volcanic activity on Jupiter’s moon Io and storms on Saturn.
New Data: Sunspot Images
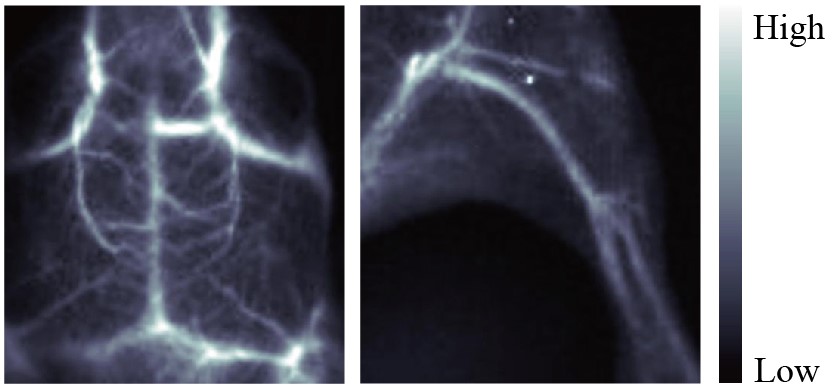
An example of the utility of the latest generation of deeply cooled, scientific InGaAs detector technology from Princeton Instruments for ground-based observations in the J and H astronomical bands is presented in Figure 2. These two images of sunspots were acquired in 2014 using a Teledyne Princeton Instruments NIRvana:640 InGaAs camera at Yunnan Observatories’ Fuxian Lake Solar Observing Station (China).
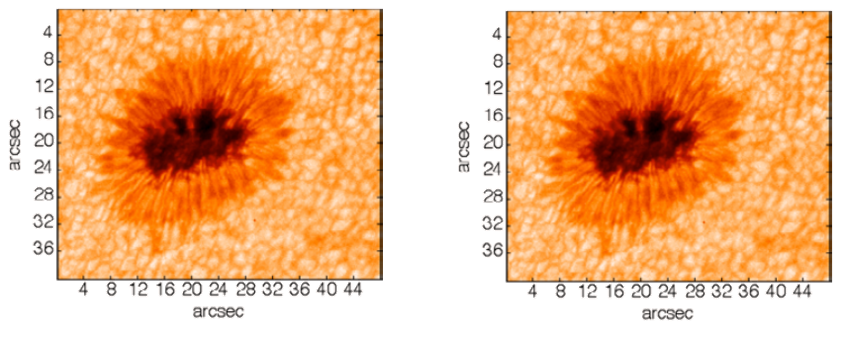
The main instrument hosted by the station is the New Vacuum Solar Telescope (NVST), a 1 meter infrared solar observation telescope. The primary scientific mission of NVST astronomers consists of obtaining high-resolution images and spectra of the sun at wavelengths ranging from 0.3 to 2.5 microns for the purposes of studying the fine structures of solar magnetic fields, as well as evolutionary processes in high temporal and spatial resolution.
Enabling Technology
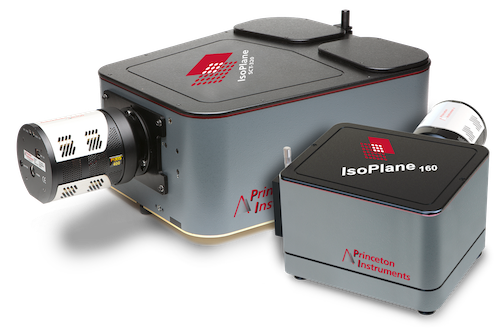
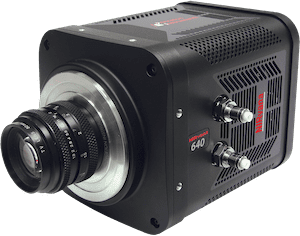
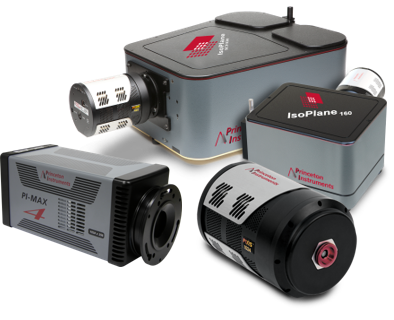
Ground-based observations in the J and H astronomical bands of the NIR-II / SWIR can be improved by utilizing newly developed, deeply cooled, scientific InGaAs cameras (see Figure 3) from Princeton Instruments.
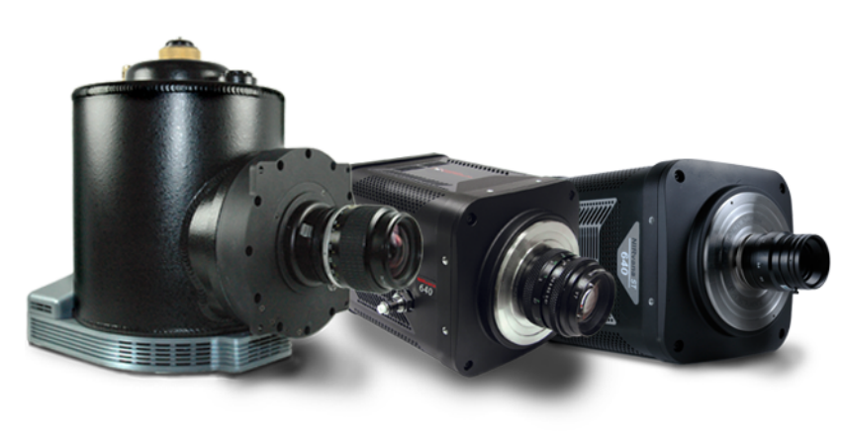
The NIRvana® family of InGaAs cameras from Princeton Instruments differentiates itself from other InGaAs cameras via a number of scientific performance features, including deep cooling, low dark noise, high linearity, low read noise, high frame rates, intelligent software, and precision control over integration times.
First and foremost, either maintenance-free thermoelectric cooling or liquid nitrogen can be employed to chill the NIRvana’s two-dimensional 640 x 512 InGaAs focal plane array down as low as –85°C (188 K) or –190°C (83 K), respectively. A proprietary cold shield design and sealed vacuum technology facilitates the lowest possible dark noise, which helps increase sensitivity as well as preserve signal-to-noise ratio (SNR) for long exposure times. It should be noted that all infrared detectors used by modern telescopes (i.e., detectors designed for NIR sensitivity as well as detectors designed for mid-IR or far-IR sensitivity) require deep cooling to minimize thermally generated dark noise that would otherwise swamp the desired
photonic signal.
Thermoelectrically cooled NIRvana cameras have the ability to expose up to many minutes, whereas LN-cooled NIRvana camera exposure times can reach 1 hour. Ultra-low-noise readout electronics help ensure good SNR even when the cameras are operated at their maximum full-frame readout rates (i.e., 110 full frames per second for thermoelectrically cooled cameras; 2.77 full frames per second for LN-cooled cameras). Furthermore, excellent system linearity means that NIRvana cameras collect highly reliable astronomical data.
Princeton Instruments’ 64-bit LightField® software, available as an option, provides a powerful yet simple-to-use interface that puts real-time online processing capabilities at astronomers’ fingertips. NIRvana cameras are easy to integrate with telescopes. Full triggering support is provided for precise synchronization with external equipment.
Deeply cooled, ultra-high-sensitivity NIRvana InGaAs cameras are ideal for making ground-based observations in the J and H astronomical bands.
References
- National Research Council. Optimizing the U.S. Ground-Based Optical and Infrared Astronomy System. Washington, DC: The National Academies Press, 2015.
- Persson S.E., Murphy D.C., Krzeminski W., Roth M., and Rieke M.J. A new system of faint near-infrared standard stars. Astron. J. 116, 2475–2488 (November 1998). DOI: 10.1086/300607
- Ge J., McDavitt D., Chakraborty A., Bernecker J., and Miller S. Adaptive optics highresolution IR spectroscopy with silicon grisms and immersion gratings. Proceedings of SPIE. (February 2003). DOI: 10.1117/12.459156
- Lyubenova M., Kuntschner H., Rejkuba M., Silva D.R., Kissler-Patig M., and TacconiGarman L.E. Integrated J- and H-band spectra of globular clusters in the LMC: implications for stellar population models and galaxy age dating. Astron. Astrophys. 543 (May 2012). DOI: 10.1051/0004-6361/201218847
- Goulding N.T., Barnes J.R., Pinfield D.J., Kovacs G., Birkby J., Hodgkin S., Catalan S., Sipocz B., Jones H.R.A., del Burgo C., Jeffers S.V., Nefs S., Galvez-Ortiz M.-C., and Martin E.L. J band variability of M dwarfs in the WFCAM transit survey. Mon. Not. R. Astron. Soc. 427(4). (November 2012). DOI: 10.1111/j.1365-2966.2012.21932.x
- Terrien R.C., Mahadevan S., Bender C.F., Deshpande R., Ramsey L.W., and Bochanski J.J. An H-band spectroscopic metallicity calibration for M dwarfs. Astrophys. J. Lett. 747(2) (February 2012). DOI: 10.1088/2041-8205/747/2/L38
Further Information
Cool Gas in the Middle of the Sun
Article discussing research by Dr. Shadia Habbal, in which unexpected cool gas was found in the Sun.
Related Products
See our extensive list of products for astronomy, with cameras for high speed, steady state imaging, J- and H-band imaging and spectrometers.

Get In Touch
Speak to a member of our team about your specific application, and what we can do to help you.