A novel imaging technique using plasmonics enables observations of nanoparticles with enhanced sensitivity.
Prof. Wei-Chuan Shih and his coworkers from the Nano-bio Photonics lab at the University of Houston are researching the use of nanomaterials and devices in applications related to biomedicine, energy and the environment. Using plasmonics the group developed a new imaging technique based on localized surface plasmon imaging that can detect particles with a smaller diameter than 25 nm.
The researchers refer to the technique as PANORAMA (ultra near-field modulated plasmonic nano-aperture label-free imaging). Compared to other plasmonics based imaging techniques, PANORAMA achieves very high spatial and vertical resolution using localization and evanescent wave properties of localized plasmon effects. The technique also uses ordinary bright-field illumination to produce larger signal strength that can be used for fast imaging of nanoparticles on mm-exposure times.
The experimental setup uses an inverted microscope with a ProEM 1024 EMCCD camera for detection where a 20 nm wide bandpass filter is placed in the Fourier plane of a 4f optical system that is located between the sample and the camera. The filter is chosen to be on the red side of the extinction due to localized surface plasmon resonance.
The sample is illuminated through an array of Au nano disks with average size 360 nm and 50 nm thickness. If an object of interest enters the nearfield range of the disk array, the changes in refractive index cause a redshift of the extinction and increased light transmission that can be detected on the camera.
The group demonstrates that the technique can be used to compare the size of polystyrene nanoparticles to sizes below 25 nm as well as to measure the dynamics of particles approaching the surface. Due to the bright illumination, good signal to noise is achieved even for short exposure times in the millisecond range. Moreover, the technique does not suffer from effects causing bleaching or low emission as no fluorescent labels are being used.
In the future the technique could be combined with surface functionalization methods to investigate nanoparticles, vesicles and viruses in biomedical sensing and imaging applications.
X-ray μCT Provides Nondestructive, High-Resolution 3D ImagingApplication Notes
Introduction
Since the early 1970s, x-ray computed tomography (CT) has been one of the most versatile, non-invasive investigative techniques in the medical field. It has also enabled nondestructive investigations in many other fields over the past few decades, including industry, archaeology, life science, geoscience, and crime investigations. Unfortunately, conventional x-ray CT systems are only able to achieve spatial resolution at the sub-millimeter scale. Thus, the technique is insufficient for examining the internal structure of objects that require resolution at the micrometer and nanometer scales.
X-ray computed microtomography (μCT), a more technologically advanced technique, overcomes this critical limitation via the use of high-resolution, wide-dynamic- range CCD cameras, high-resolution scintillators, either synchrotron x-ray sources or microfocus x-ray tubes, and software algorithms designed to reconstruct 3D images.
A typical μCT solution comprises an x-ray source, a high-resolution rotating stage with a sample holder, a high-performance scientific CCD camera, and a computer. Depending on the system configuration, either fiberoptic coupling or optical lens coupling is utilized to project an image onto the CCD detection array. Recent advances in all of the above-mentioned technologies enable spatial resolution on the order of microns (see Figure 1).
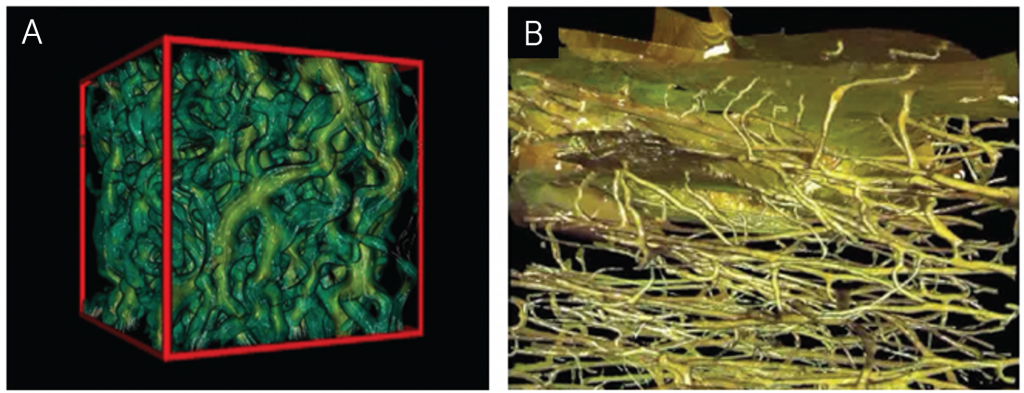
Figure 1: (A) Simulated fluid streamlines through the pore space in coral. (B) Human cortical bone showing Haversian and Volkmann’s canals. Voxel size = 4 μm3. Images courtesy of Dr. Tim Senden, ANU, Canberra, Australia.
Figure 2: Diagram and image depicting an optical lens-coupled μCT system. Image courtesy of Dr. Yangchao Tian, NSRL, Hefei, P.R. China.
X-ray μCT at a third-generation synchrotron source
Extremely bright (i.e., high-flux) x-ray beams generated by synchrotron sources around the world are steadily increasing the utility of x-ray μCT in a number of research fields. Different configurations of x-ray beams (i.e., high-flux parallel beams or highly focused submicron beams) and high-resolution scintillators make it possible to extend the submicron scale, even below 100 nm, while maintaining reasonable data-acquisition times.
The work of geoscientist Dr. Mark Riversof the University of Chicago provides an excellent example of the use of an x-ray μCT system at a third-generation synchrotron. In this particular μCT system, the transmitted x-rays are converted to visible light with a single-crystal YAG scintillator, which is imaged via either a microscope objective (5x to 20x) or a zoom lens, with the field of view adjusted between 3 mm and 50 mm. The image is then projected onto a CCD.
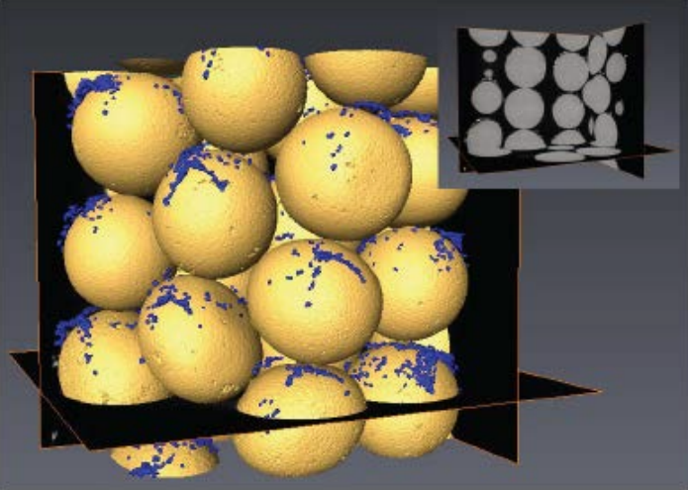
Dr. Rivers’ data-collection software uses a layered approach in which each layer has a specific function. Data processing consists of preprocessing, sinogram creation, and tomographic reconstruction (see Figure 3).
Figure 3: Glass beads (gold) with silver microspheres (blue). Image courtesy of Gabriel C. Ilitis, Oregon State University, and Dr. Mark Rivers, University of Chicago.
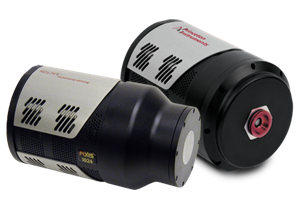
The vast majority of x-ray μCT systems employed at third-generation synchrotron sources feature either a camera based on advanced electron-multiplying CCD technology (e.g., Teledyene Princeton Instruments ProEM) or a shutterless, interline-transfer CCD camera (e.g., Teledyne Photometrics Retiga R6). These types of scientific cameras provide the high speed and outstanding sensitivity required for μCT experiments.
Figure 4A, B and C illustrate the technique’s broad utility for performing work in diverse, complex fields such as materials science.
Figure 4: (A) Nanoparticle – image courtesy of Dr. Yangchao Tian, NSRL. (B) Lava synthesized at high temperature – image courtesy of Liping Bai and Don Baker, Earth and Planetary Sciences, McGill University, Montreal, Canada, and Dr. Mark Rivers, University of Chicago. (C) PCL-TCP-PLA sample, voxel size = 0.7 μm3 – image courtest of Prof. M. Cholewa, SSLS, Singapore.
While third-generation synchrotron sources undoubtedly represent an extremely powerful research tool, limited access and expensive operationcostsprove prohibitive to many scientists and industries. In the past several years, however, significant advancements in x-ray sources, detectors, sample stages, and computers have led to the design of “desktop” x-ray μCT systems that successfully bring a fair degree of this imaging performance to large and small labs alike.
Desktop x-ray μCT with a microfocus x-ray tube
Instead of relying on an x-ray synchrotron source, desktop μCT systems use a microfocus x-ray tube with a focal spot size of less than 1 μm to achieve spatial resolution of features smaller than 100 nm. This emergent class of desktop systems embodies improvements in x-ray resolution, easy-to-use instrumentation, application flexibility, and affordability.
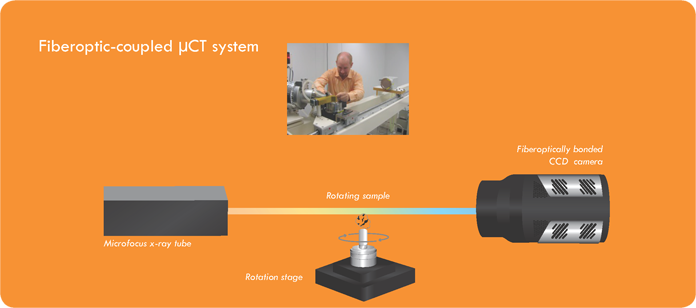
There are two fundamental kinds of desktop x-ray μCT systems. One uses fiberoptic coupling to project an image onto the CCD, whereas the other utilizes optical lens coupling. If high speed is important in an application (e.g., exposure times of 1 to 10 seconds), then a fiber-optic-coupled system is generally considered advantageous.
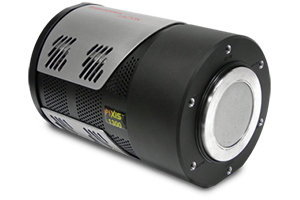
To accommodate higher x-ray flux, fiberoptic-coupled desktop μCT systems can use fast-readout, high-sensitivity CCD cameras, such as the Teledyne Princeton Instruments PIXIS-XF.
For x-ray imaging applications that require longer exposure times (e.g., 10 to 30 seconds, or even up to a few minutes), a high-sensitivity detector that can be deeply cooled to reduce dark current is essential. The utilization of Fresnel zone plates to focus the x-rays via diffraction onto the sample allows the use of optical lens coupling in the μCT system, which in turn necessitates deeper cooling of the detector.
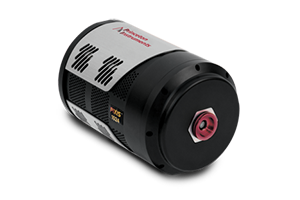
To preserve sensitivity and spatial resolution, optical lens-coupled desktop μCT systems often employ cooled cameras designed with megapixel, high-quantum-efficiency CCDs (e.g., Teledyne Princeton Instruments PIXIS: 1024B/F and 2048B/F)
Figure 5: Diagram and image depicting a fiberoptic-coupled μCT system.
Conclusion
The use of x-ray μCT systems in conjunction with third-generation synchrotron sources has facilitated advances in many research fields (e.g., materials science, geoscience, archaeology, life science, and drug discovery via small-animal CT) by offering truly remarkable performance, but appreciable expenses and tight scheduling bar many from this means of exploration.
Over the past few years, hundreds of new desktop x-ray μCT systems from several manufacturers have been installed in labs around the world. These systems, which rely on microfocus x-ray tubes instead of synchrotron sources, represent an ongoing trend towards miniaturization and personalization of research technology.
Ongoing improvements in x-ray optics, sample stages, and scientific detectors continue to pave the way for new scientific breakthroughs (e.g., the development of electronic packages and more efficient fuel cells). In addition, the intelligent fusion of x-ray phase-contrast imaging and μCT techniques will open still more doors for researchers, enabling the imaging of extremely low absorption materials as well as delivering tools to diagnose cancer at even earlier stages.
Researchers from Germany use a new setup with dynamically adjustable focus to improve the quality of Raman spectroscopy with handheld Raman probes for applications in biological and clinical spectroscopy.
Researchers around Jürgen Popp and Iwan Schie from Jena (Germany), are exploring the use of Raman spectroscopy for the characterization of biomaterials and the detection of diseases. Raman spectroscopy combines the advantages of having extremely high ability for identifying molecules (molecular fingerprints) while being a label free technique.
However, Raman scattering is a weak process with typically less than one in a million photons interacting with the sample, so sensitive instrumentation is crucial for signal collection, in particular in clinical and surgical applications of the technique
Raman spectroscopy on biological tissue prefers the use of fiber optic probes due to their small size and high flexibility for measuring samples that are difficult to access with standard microscopy setups.
While Raman setups for tissue measurements often use contact probes, non-contact measurements can be more desirable to avoid sample damage or contamination. Non-contact probes rely on optical lenses to focus the excitation laser onto the sample as well as collect the signal, however the signal collection is extremely sensitive to changes in focus position. This is particularly important for handheld probes where it is harder to maintain a fixed working distance to the sample.
In a recent publication the researchers from Jena describe a new setup with “a new fiber optical Raman probe design and implementation with an integrated liquid lens that allows a rapid focal distance adjustment and enables significant signal stabilization when compared to a fixed-focus implementations.” The researchers describe the experimental setup using a FERGIE-785 nm laser for excitation at 300 mW as well as a LS-785 spectrometer with a PIXIS-100BRX CCD camera for detection of the Raman signal.
The new setup is characterized using open loop control and external ultrasonic distance sensor as well as a closed loop approach based on optimizing the detected Raman signal. The feedback is used to adjust the focal length using the liquid lens. The closed loop approach promises better optimization accuracy but is challenging to implement when signal levels are weak. The new setup is successfully applied to handheld measurements as well as Raman imaging scans over a tilted sample.
The new adjustable focal length setup is not only successfully improving the performance of handheld Raman spectroscopy probes but can also be applied to other measurement techniques.
X-Ray phase contrast imaging returns valuable information about frozen hydrogen shells used as fuel for laser ignited fusion experiments.
Introduction
Researchers at the Laboratory for Laser Energetics in Rochester are using X-Ray imaging to characterize frozen hydrogen shells that are used as fuel in fusion experiments. The lab develops and conducts experiments, materials and technologies as part of a national program on inertial confinement fusion. This process uses spherical shells consisting of deuterium and tritium. The fusion process is initiated by an intense laser beam, leading to the explosion of the outer layer of the micrometer sized spheres and driving compression and heating of fuel inside the shells.
X-Ray phase contrast imaging is a useful technique to analyze structure in materials. It observes interference due to phase differences created by different index of refraction in materials. Phase contrast imaging can even be applied to materials like hydrogen where X-Ray absorption is low.
The X-Ray phase imaging setup at LLE uses a microfocus X-Ray source in 165 mm distance from the sample and a PIXIS-XB direct detection camera in 1140 mm distance. The large distance of the detector is chosen to magnify the image to a resolution of 1.6 μm/pixel. The X-Ray measurements are compared to visible light shadowgraphy measurements to figure out which technique is best suited for measuring specific properties of the ice shells.
The X-Ray measurements show the suitability of the technique to measure the thickness and defects in the deuterium-tritium layers, in particular for measuring longer wavelength fluctuations, as the X-Rays are less affected by small defects compared to the visible measurements. Combined with the visible imaging techniques, X-Ray phase imaging can help to identify highest quality ice layers where the results of both measurements techniques give the most similar results.
Optical spectroscopy is used to analyze how well newly developed biosensors based on carbon nanotube sensors work.
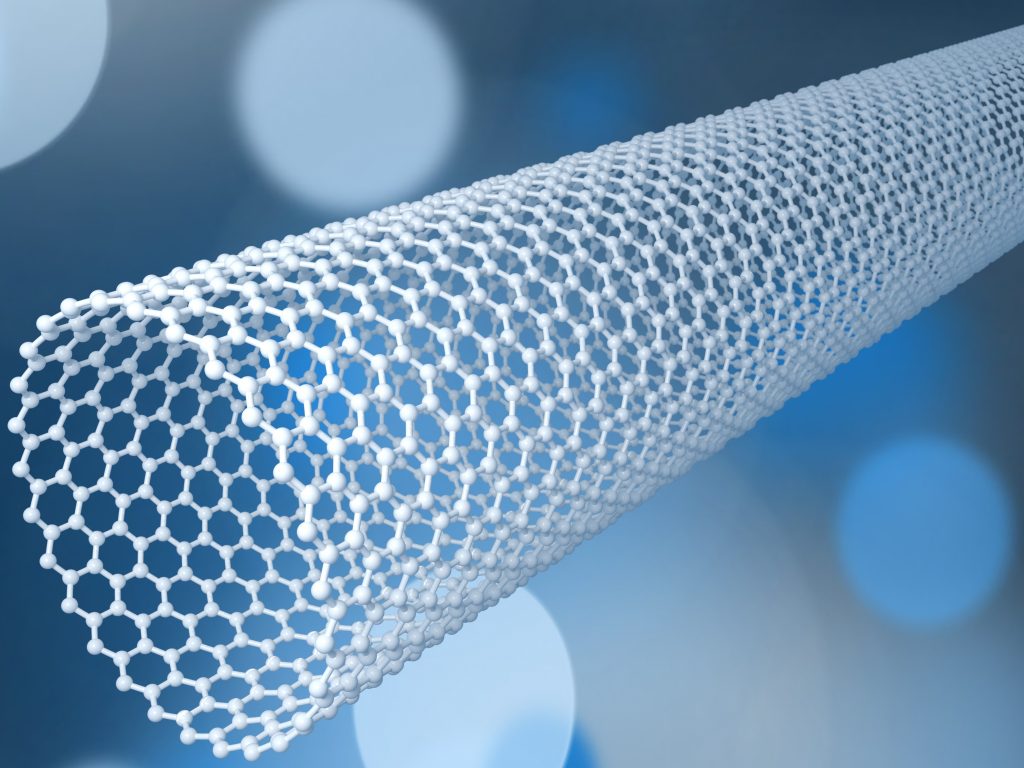
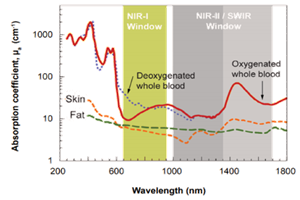
The development of fluorescent nanoprobes for the NIR-II/SWIR band is seeing rapid growth due to the increasing development of biomedical and clinical applications of imaging in this wavelength band. In the NIR-II band between 1000nm and 1700nm scattering and absorption in tissue are low allowing for greater penetration depth of radiation into opaque tissues while maintaining high degrees of resolution. Single wall carbon nanotubes are one of the common optical probes for biomedical sensing due to their high stability and ability to functionalize their surface for increasing the sensitivity to detect specific molecular targets.
Among a wide range of molecules that can be used for surface functionalization, proteins have one of the highest abilities for molecular targeting. However, as researchers around Vitalijs Zubkovs and Ardemis Boghossian from EPFL in Lausanne Switzerland note, developing nano-sensors requires binding of a protein to the “nanotube surface in a controlled oriented manner while retaining its bioactivity” while simultaneously preserving the fluorescence of the nanotube. Successful strategies for protein-based functionalization use methods to wrap the nanotubes in DNA or a linker molecule that then covalently bonds to the protein in a way that retains the protein folding and molecular targeting properties.
In an article the journal Chemical Materials they discuss a new method of binding a yellow fluorescent protein to nanotube surfaces using a linker molecule and find that their approach is not only more cost effective than more established methods using DNA, but also increases the stability of the proteins.
The researchers use a wide range of optical and spectroscopic methods for analyzing the optical and fluorescent properties of the functionalized nanosensors, for example absorption spectroscopy and circular dichroism spectroscopy. As the nanotube probes are developed for applications in the NIR-II fluorescence spectroscopy is used to probe the emission in this wavelength range.
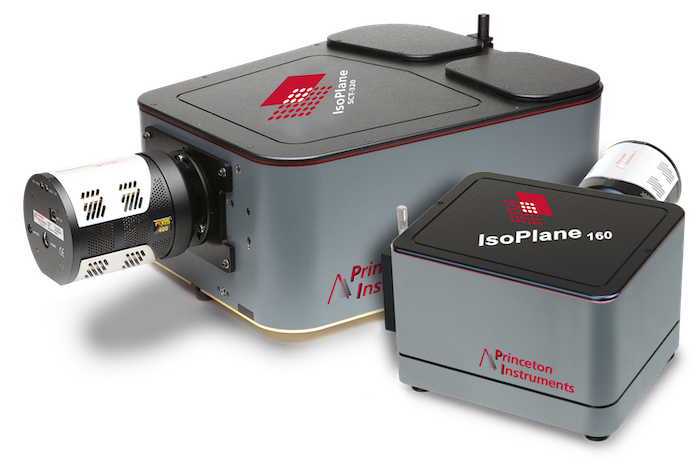
The setup for NIR-II fluorescence spectroscopy uses a focused 660nm laser for excitation of particles in a well plate. The signal is detected using an IsoPlane SCT-320 spectrograph with a NIRvana InGaAs camera. The researchers utilize the sensitivity of the nanotube emission to the environment to analyze the binding properties of the other molecules and proteins. For example, monitoring the position of the emission lines of molecules dissolved in water allows conclusions about the surface coverage of adsorbed molecules on the nanotube surface as the spectral lines will shift due to changing access of water molecules to the nanotube surface.
In conclusion the team from Lausanne writes that their “linker strategy therefore introduces an alternative approach that combines the advantages of non-specific adsorption and of site-specific ssDNA-based conjugation strategies”.
Precise measurements of light scattering by single Au nanoparticles can give detailed insights into the physical and chemical molecular processes on the particle surface.
Nanotechnology and plasmonics play an important role in applications and research related to biochemical sensing as the interaction of metallic nanoparticles with light is extremely sensitive to the physical and chemical environment.
For many applications of nanoparticles the properties and chemical composition of their surface play a crucial role in how they are being used experimentally. As nanoparticles are often created in chemical processes, molecules and surfactants that are necessary for reliable production quality will be adsorbed and bound to their surface.
Researchers around Andras Deak from the Centre for Energy Research in Budapest (Hungary) are interested in understanding the chemical processes happening on the surface of gold nanoparticles. In a recent article they report on experiments where they monitor binding of thiols, organic sulfur molecules, to particle surfaces. According to the researchers “the strong gold-sulfur bond provides a convenient way for a myriad of surface modification strategies that have been exploited with great success over the past few decades” making these molecules particularly interesting for applications.
To investigate the effects on the surfaces, the researchers perform micro-spectroscopy to measure the darkfield scattering spectra of individual nanoparticles to show the replacement of the original CTAB (hexadecyltrimethylammonium bromide – a commonly used surfactant in nanoparticle synthesis) capping layer with 2 different kinds of thiols.
The experiments use the high sensitivity of the plasmonic resonance effect in the gold particles to the dielectric environment that is influenced by the surface adsorbed molecules. Specifically, previous measurements have shown that the width of the resonance increases due to a process called chemical interface damping – when thiols bind to clean surfaces. The researchers find that similar observations give insight into the ligand replacement process performed in the reported experiments.
The experiment setup for measurements on single nanoparticles uses an Olympus BX 51 microscope equipped with a piezo stage for precise positioning of samples. The article describes that “the microscope is coupled to an aberration corrected imaging spectrograph (Princeton Instruments Isoplane SCT320 with PIXIS:400BRX -70°C cooled CCD camera).”
The darkfield scattering spectra show a fairly sharp resonance peak that is analyzed using a simple harmonic oscillator model so the peak is fitted by a Lorentzian response function to extract the position and width of the lines. Observing the shifts and broadening of the plasmonic resonance for different concentrations of the investigated chemicals shows the degree of binding and replacement of the original capping layer.
The researchers conclude that their measurement scheme of careful observation of the position and width of the plasmon resonance peak is working well for monitoring ligand exchange on particle surfaces. Based on this technique the team was able to conclude that their results “highlight the central role of intermolecular forces in the surface modification process.”
Plasmas and electric discharges have a wide range of applications from material processing, cleaning and disinfection, to treatment of cells and tissues. Modeling the discharge processes in plasmas can be extensive and requires a lot of computational resources if all interactions and physical details are considered. However, in many situations, when justified by the experimental conditions, simplified models can be used to save time and increase efficiency.
Researchers around Mohammed Yousfi from Toulouse demonstrate the application of such models by performing measurements on plasma discharges created by pulsed electron beams in air. According to the researchers using an electron beam has advantages over electric field induced plasmas that make the results of their studies applicable to a wider range of experimental situations.
In addition to microwave absorption, optical emission spectroscopy is used in the experiments to characterize the physical properties of the discharge. The optical signal is picked up by a fiber with 400 μm core diameter and detected by an IsoPlane 320 spectrograph using a PI-MAX 4 emICCD. Using the ultrafast measuring capabilities of the intensified camera, the optical spectra specifically are used to investigate the relaxation of the plasma after the electron beam passes through. Spectra are taken using a 50 ns exposure time, which is positioned at 4 different points in time within 150 ns after the pulse passes.
Using a 2400g/mm grating the experiment achieves an optical resolution of 0.065 nm and the optical spectra of discharge in air show the rotational and vibrational structure of nitrogen molecules.
Using this data Prof. Yousfi and his team are able to determine the vibrational and rotational temperature of the molecules discharge and confirm that the vibrational excitations become the dominant process for energy dissipation.
Multichannel imaging of 1D Raman spectra in burst acquisition modes allows researchers to better understand the processes in combustion flames.
Understanding combustion processes requires understanding of behavior of molecules in flames, which is characterized by parameters such as temperature and molecular concentration for different locations in the combustion flame. Raman scattering is a commonly used technique for these measurements it is non-intrusive and can identify different kinds of molecules, however Raman signals are relatively weak due to the low Raman scattering cross sections.
To circumvent this problem researchers around Gaetano Magnotti from King Abdullah University of Science and Technology developed a measurement setup using a high intensity pulse-burst laser system and highly sensitive EMCCD cameras to measure Raman scattering of all molecular species in a hydrogen-air flame simultaneously. Their dynamic 1D Raman measurement setup is able to determine the molecule concentration and temperature at different positions in the flame and measure their dynamics on millisecond timescales.
The pulse burst laser system is able to output short trains of pulses at kHz rates and pulse width in the nanosecond range. When focused into the combustion region the high energy per pulse of this system produces Raman signals sufficiently large for detection with back-illuminated EMCCD cameras.
Individual molecule species are addressed by use of a separate camera for each species, so a total of 4 cameras are being used to monitor the Raman signals of hydrogen, oxygen, nitrogen and water. The optical signal is separated by wavelength using a modular system of bandpass filters and dichroic mirrors (which could be expanded to monitor the 7 major molecular species in methane-air flames).
For detection a Princeton Instruments ProEM-HS EMCCD camera is used per channel. The researchers note that the use of direct imaging with a back-illuminated CCD increases the signal to noise ratio and image quality of their observations.
To measure the dynamic behavior of the combustion flame the experiment operates the laser at 5kHz repetition rate and uses a special burst operation mode, called kinetics, of the ProEM-HS camera that is able to quickly shift signal across the sensor. To operate in this mode, the researchers introduce a slit in the optical system that acts as a spatial filter so only a few rows of the camera sensor are being illuminated. In this way the camera can be operated at twice the laser frequency at 10kHz. One frame is synchronized with the laser pulse and contains the Raman signal and luminescent flame background. The next frame only contains luminescent flame background that can be subtracted from each signal frame.
The researchers conclude that using this system they were able to measure combustion parameters with “precision and accuracy comparable with the widely used low-speed Raman system”, however using kHz acquisition rates.
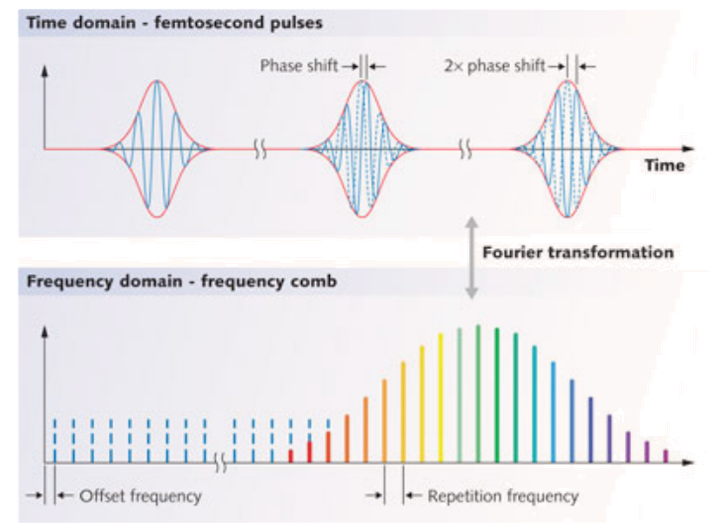
A frequency comb is a spectrum that comprises a series of discrete, equally spaced elements. The most popular mechanism used to generate a frequency comb is stabilization of the pulse train by a mode-locked laser. In 2005, John L. Hall and Theodor W. Hänsch shared one half of the Nobel Prize in Physics for their contributions to this important area. Recently developed techniques based on femtosecond frequency combs (see Figure 1) can be utilized in a wide range of advanced measurement applications, including high-precision spectroscopy, atomic clocks, chemical sensors, super lasers, long-distance communications, and LIDAR.
Figure 1. Time and frequency domains of a typical frequency comb. Published in J. Hecht, “Frequency combs make their way to the masses,” Laser Focus World, 48, 1, 103–108 (Jan. 2012).
Researchers at Texas A&M University, led by Prof. Hans A. Schuessler, recently employed a scientific InGaAs camera from Princeton Instruments to perform femtosecond frequency comb vernier spectroscopy in the near infrared via a simple experimental setup1. Their innovative work, which has broad applications for sensing greenhouse gases in the fingerprint NIR region, is the focus of this application note.
Basics
Femtosecond frequency combs provide a regular comb structure consisting of millions of simultaneously accessible narrow-linewidth laser modes2. Over the past decade, a number of methods have used this broad-spectral-bandwidth and high-resolution comb structure for spectroscopy ranging from the extreme ultraviolet to the terahertz region1.
The principle of frequency comb vernier spectroscopy was first introduced in 2007 by C. Gohle et al.3 and is briefly outlined below 1. The cavity length L is intentionally adjusted to make the cavity free spectral range (FSR=c/(2nL)) mismatch the repetition rate fr of the frequency comb, so that only every mth comb mode is on resonance with every (m-1)th mode of the cavity, and the modes of the original frequency comb and the resonant frequencies of the cavity resemble a vernier with a ratio of FSR/fr=m/(m-1).
Figure 2 shows the case of FSR/fr=10/9. If the finesse of the cavity is high enough, the other off-resonance comb modes will be strongly suppressed, which results in an effective spectral filter for the original comb. The frequency comb filtered by the cavity has a mode spacing of mfr , thus for a large number m, it can be resolved with a simple grating-based spectrograph1.
Figure 2. Scheme of frequency comb vernier spectroscopy for the vernier ratio of FSR/fr=10/9. Red dotted lines are frequency comb modes; black solid lines are cavity resonant modes. Large red dots mark the transmitted comb modes1. Diagram courtesy of Prof. Hans A. Schuessler, Texas A&M University. Published in F. Zhu et al., “Near infrared frequency comb vernier spectrometer for broadband trace gas detection,” Optics Express 22(19) 23026–23033 (2014).
Experimental Setup
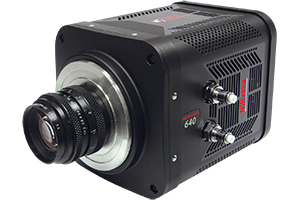
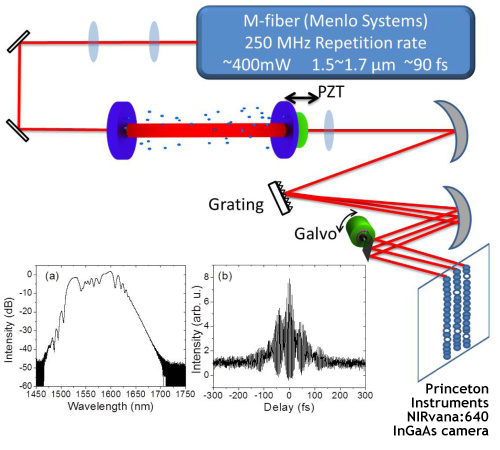
The Texas A&M experimental setup is depicted in Figure 3. A femtosecond Er-fiber laser was used as a frequency comb source and a Princeton Instruments NIRvana:640 scientific InGaAs camera was employed for detection. After the mode matching lenses, the frequency comb was coupled into a scanning high-finesse Fabry-Perot cavity consisting of a flat mirror and a 2 m radius concave mirror. A 50 mm x 50 mm, 300 grooves/mm gold-coated grating was utilized in a 300 mm focal length Czerny-Turner spectrometer. A tilting mirror driven by a galvo, which was synchronized with the scanning cavity, was used to map different groups of filtered combs onto one spatial dimension of the InGaAs camera’s sensor1.
Figure 3. The experimental setup includes an NIR frequency comb source, mirrors and mode matching lenses, a scanning high-finesse cavity, a Czerny-Turner spectrometer, a tilting mirror driven by a galvo, and a scientific InGaAs camera. Insets: (a) spectrum and (b) interferometric autocorrelation trace of the femtosecond Er-fiber laser.1 Diagram and data courtesy of Prof. Hans A. Schuessler, Texas A&M University. Published in F. Zhu et al., “Near infrared frequency comb vernier spectrometer for broadband trace gas detection,” Optics Express 22(19) 23026–23033 (2014).
The NIRvana:640 features a two-dimensional 640 x 512 InGaAs focal plane array (FPA) with a pixel size of 20 μm x 20 μm. The exposure time of the camera was synchronized with the PZT scanning and galvo tilting to record one single-scan image. To reduce system noise attributable to dark current, the FPA was thermoelectrically cooled to −80°C. Acetylene was chosen as a sample because it has an absorption band between 1510 nm and 1550 nm, which lies within the sensitivity range of the InGaAs camera1.
Results and Discussion
The cavity was first filled with a mixture of 5 ppmv acetylene and air at room temperature and atmospheric pressure to take the sample image. Compressed air was then used to purge the cavity, allowing the researchers to acquire the reference image under the same conditions. Images with a 500 msec scan time displayed good intensity contrast. By tuning the cavity length L, the vernier ratio could be changed1.
For the vernier ratio of 500/499, the filtered comb spacing was 125 GHz, and the resolution under these conditions was 1.1 GHz, corresponding to about to 5 comb modes. For the vernier ratio of 250/249, the resolution was 550 MHz, corresponding to about 2 to 3 comb modes.
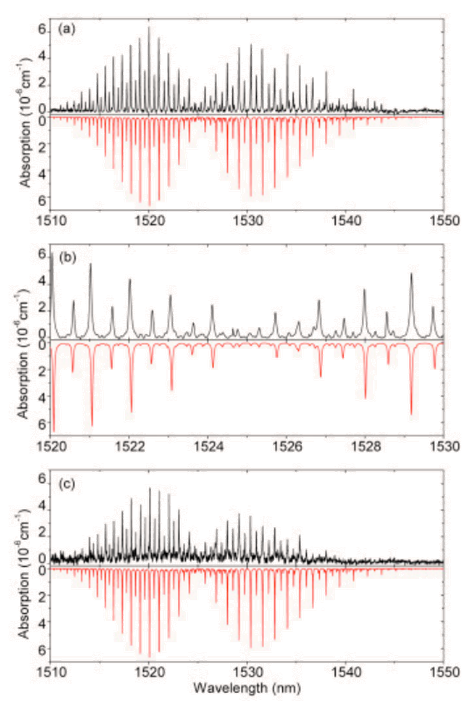
Figure 4 presents the absorption spectrum retrieved from the images. Provided a higher-resolution spectrometer with a larger grating and a spot size better matching the FPA pixel size, it seems possible to resolve the single frequency comb modes of a few hundreds MHz spacing with the future development of cameras1.
Figure 4. Acetylene absorption spectrum retrieved from images of 500/499 and 250/249 vernier ratios (black) and comparison with HITRAN simulation of 5 ppmv acetylene at room temperature and atmospheric pressure (red, inverted for clarity): (a) in the broad range from 1510 to 1550 nm and (b) expanded view from 1520 to 1530 nm for the vernier ratio 500/499; (c) in the broad range from 1510 to 1550 nm for the vernier ratio 250/249 (note that due to the reduced power of the resolved frequency elements, the signal-to-noise ratio in this case is lower compared to the case of the 500/499 vernier ratio).1 Data courtesy of Prof. Hans A. Schuessler, Texas A&M University. P Published in F. Zhu et al., “Near infrared frequency comb vernier spectrometer for broadband trace gas detection,” Optics Express 22(19) 23026–23033 (2014).
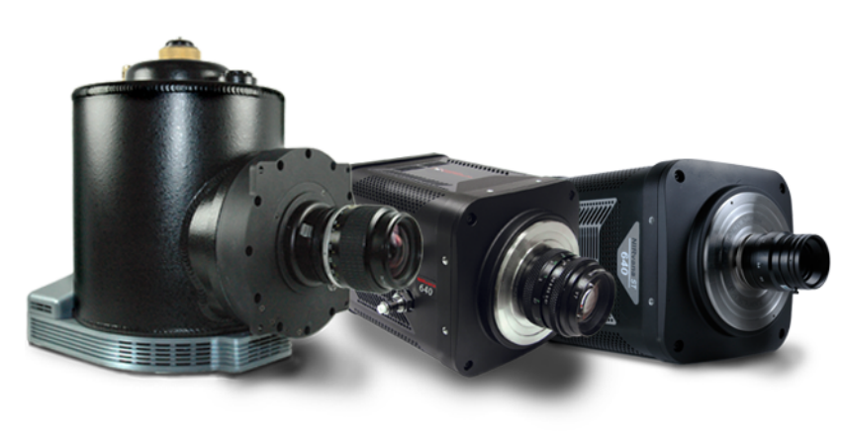
The NIRvana® family of InGaAs cameras from Princeton Instruments (see Figure 5) differentiates itself from other InGaAs cameras via a number of scientific performance features, including deep cooling, low dark noise, high linearity, low read noise, high frame rates, intelligent software, and precision control over integration times.
Figure 3: Princeton Instruments’ NIRvana® scientific cameras feature a thermoelectrically or LN-cooled 640 x 512 InGaAs detector and offer excellent sensitivity in the NIR-II / SWIR spectral range.
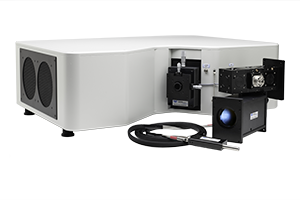
It should also be noted that while the Texas A&M experimental setup employed a home-built spectrometer, the ready-to-use, state-of-the-art Princeton Instruments IsoPlane® SCT-320 spectrometer is particularly well suited for performing leading-edge applications such as femtosecond frequency comb vernier spectroscopy in the near-infrared range. The patented design of the IsoPlane SCT-320 eliminates field astigmatism and greatly reduces coma, enabling crisp, detailed imaging across a 27 x 8 mm focal plane.
NIRvana InGaAs cameras, in addition to being utilized as part of the experimental setup at Texas A&M, are being used for many other NIR-II / SWIR applications, including semiconductor failure analysis, solar cell inspection, nondestructive testing, astronomy, small-animal imaging, and singlet oxygen detection4-7.
Zhu, J. Bounds, A. Bicer, J. Strohaber, A.A. Kolomenskii, C. Gohle, M. Amani, and H.A. Schuessler, “Near infrared frequency comb vernier spectrometer for broadband trace gas detection,” Optics Express 22(19) 23026–23033 (2014). doi: 10.1364/OE.22.023026 Open Access: https://www.osapublishing.org/oe/fulltext.cfm?uri=oe-22-19-23026&id=301333
Udem, R. Holzwarth, and T.W. Hänsch, “Optical frequency metrology,” Nature 416(6877), 233–237 (2002).
Gohle, B. Stein, A. Schliesser, Th. Udem, and T.W. Hänsch, “Frequency comb vernier spectroscopy for broadband, high-resolution, high-sensitivity absorption and dispersion spectra,” Phys. Rev. Lett. 99(26), 263902 (2007).
“Scientific NIR-II / SWIR cameras for advanced imaging and spectroscopy applications,” Princeton Instruments application note (2015).
“Solar cell inspection via photoluminescence imaging in the NIR / SWIR,” Princeton Instruments application note (2012).
Overview of the most common NIR-II probes currently used within in vitro, ex vivo and in vivo studies, including quantum dots, single-walled carbon nanotubes and rare earth nanoparticles.
Is There Really a Cool Gas in the Middle of the Sun?Application Notes
Introduction
Yes, if you ask a team of researchers from University Hawaii, Institute for Astronomy who returned from an expedition to the blistering Sahara desert, where they found an unexpected source of cool gas-in the outer regions of the Sun. The group headed by Dr. Shadia Habbal traveled to Libya to observe the March 29, 2006 total solar eclipse – a rare event in which the bright disk of the Sun is obscured by the Moon for a few minutes.
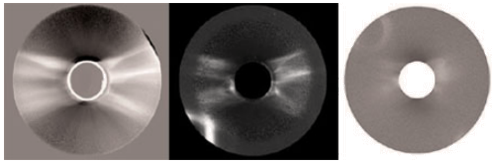
They took three new instruments specially designed to study the corona. One of them used two PIXIS: 1024BR deep depletion, back illuminated CCD cameras.
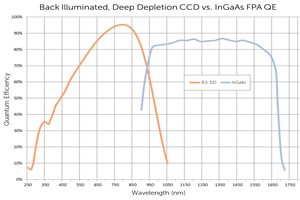
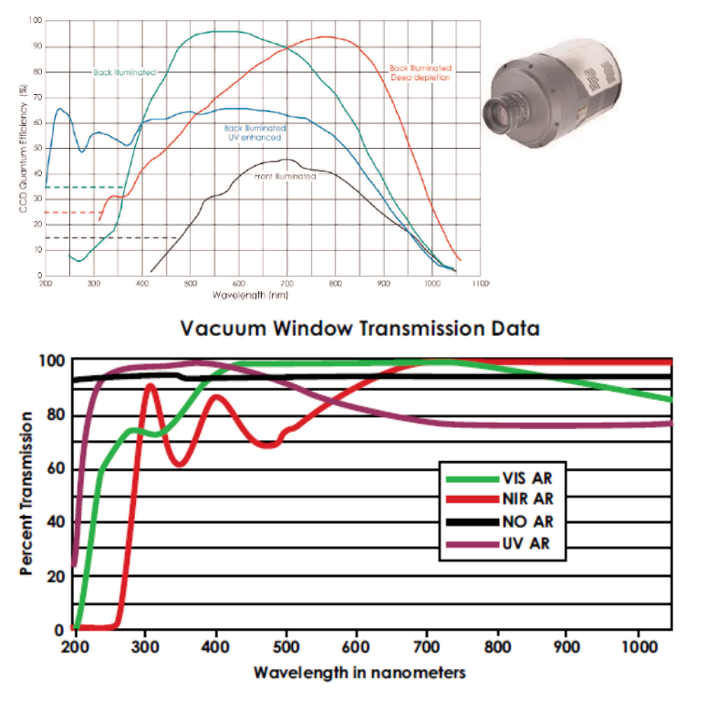
The cameras were chosen for their excellent quantum efficiency in NIR band where the most of the observations took place and lack of etaloning.
As the total eclipse lasted only few minutes, it is critical that the cameras perform flawlessly. “Our observations turned out to be a great success”, comments Dr. Habbal.
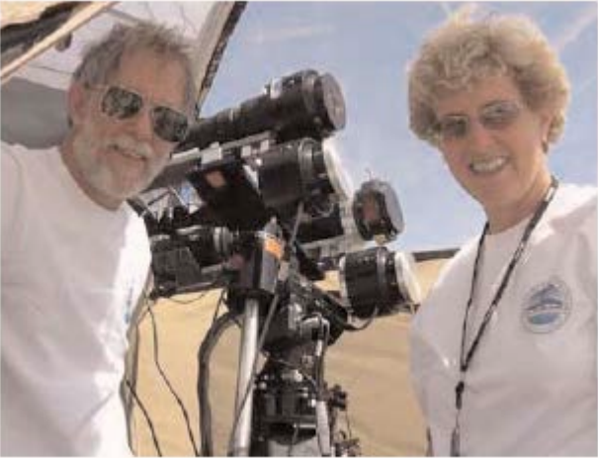
Figure 1: Judd Johnson and Shadia Habbal with two PIXIS: 1024BR cameras used to observe the total solar eclipse on March 9, 2007 in Libya
Preliminary analysis of the expedition’s observations show there was an enormous magnetic bubble that was erupting during the eclipse. With their sensitive infrared instruments, the team also discovered that the solar corona, long known to have a temperature of several million degrees, also contains a surprising amount gas that is hundreds of times cooler.
Figure 2: Images of solar eclipse captured by PIXIS: 1024BR (from left to right): Broadband image, images through around 7892ÞA and 10747ÞA filters.
Future plans include more detailed studies of corona’s elusive magnetic field using larger solar telescopes such as Advanced Technology Solar Telescope (ATST) that may be built on Maui.
PIXIS: 1024BR Deep Depletion Cameras for NIR Astronomy
PIXIS: 1024BR cameras represent the state-of-the art in low noise, deep depletion CCD cameras for NIR imaging applications. The key advantages include:
90% peak QE in NIR range (@800nm) with minimal etaloning
Permanent vacuum guarantee with all-metal hermetic seals
Low dark current through deep thermo-electric cooling below -80oC
Low read noise of 3.6 e- rms (typical)
Optimized AR coating for NIR region on the vacuum window -only optical surface in the light path
Compact size (16.77cm x 11.81cm x 11.38cm, L x W x H; 2.27 kg)
USB 2.0 interface for easy plug-n-play operation from laptops
Optional fiber optic interface for remote operation
Figure 3: Quantum Efficiency curves for various detector types available in PIXIS camera platform. Dotted lines show performance with proprietary UV coating