Characterization of Soil-Grown Root SystemsApplication Notes

A Quantitative Comparison of Different Scientific CCD Types

Overview

Recently, a team of scientists working in North America and Europe developed an innovative growth and imaging platform, known as GLO-Roots, that allows root architecture and gene expression to be studied in soil-grown plants.

GLO-Roots (Growth and Luminescence Observatory for Roots; U.S. patent application: 13/970,960) is a collaborative effort between the labs of Dr. José Dinneny at the Carnegie Institution for Science (Stanford, California), Dr. Rubén Réllan-Álvarez (Langebio, Mexico), and Dr. Guillaume Lobet at the Université de Liège in Belgium. Designed and built with help from BioImaging Solutions, Inc. (San Diego, California), the researchers’ new growth and imaging platform supports several model organisms, namely, Arabidopsis thaliana, Brachypodium distachyon, Setaria viridis, and Lycopersicon esculentum.1

GLO-Roots employs luminescence-based reporters and a pair of Princeton Instruments back-illuminated CCD cameras to enable studies of root architecture and gene expression patterns in soil-grown, light-shielded roots. Custom-designed image analysis algorithms allow the spatial integration of soil properties, gene expression, and root system architecture traits. The GLO-Roots developers assert that the new platform can offer great utility for presenting environmental stimuli to roots in ways that evoke natural adaptive responses and in providing tools for investigating the multidimensional nature of such processes.2

This application note will outline some of the research conducted by the GLO-Roots team, which is led by Dr. José Dinneny at the Carnegie Institution for Science’s Department of Plant Biology on the Stanford University campus

GLO-Roots Setup

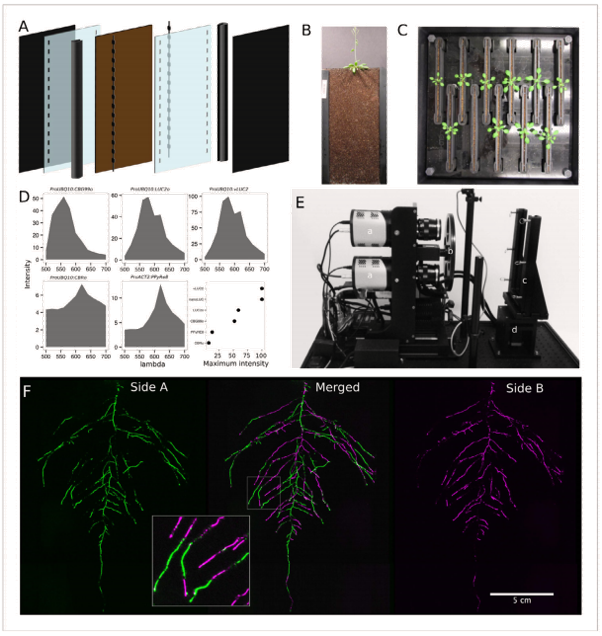
The GLO-Roots platform comprises four parts: (1) growth vessels, called rhizotrons, that permit plant growth in soil as well as imaging of roots; (2) luminescence-based reporters that allow various aspects of root biology to be tracked in living plants; (3) GLO1, a luminescence-imaging system designed to automatically image the rhizotrons; and (4) GLO-RIA, an image
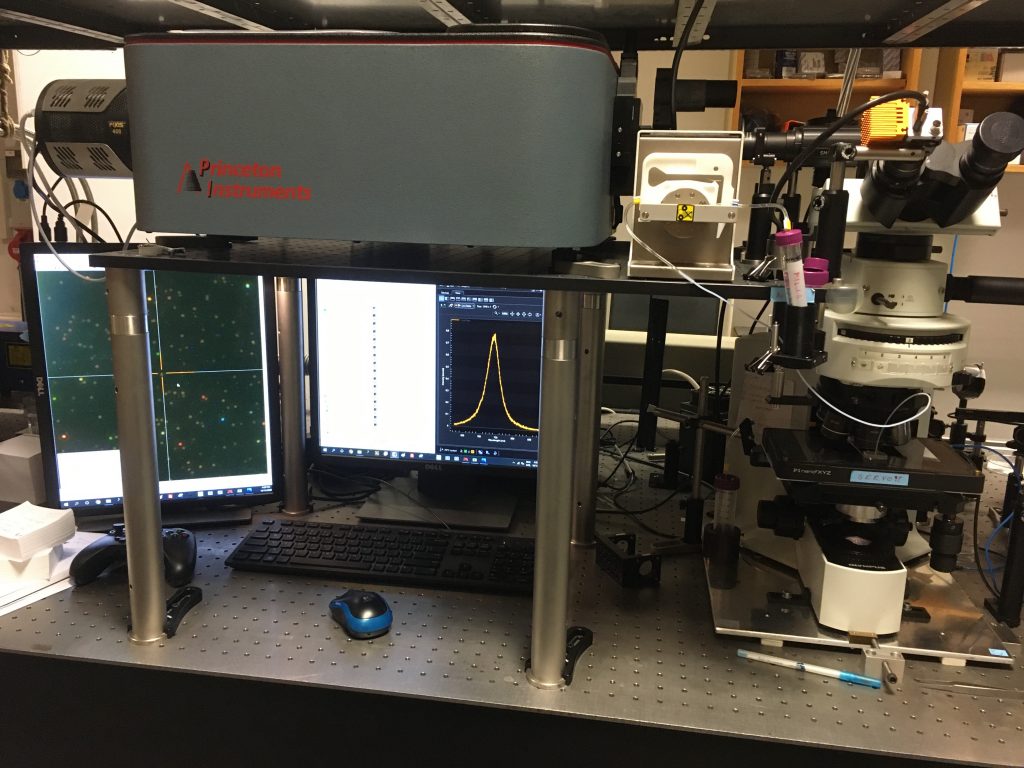
analysis suite designed to quantify the root systems imaged utilizing GLO1.2 An example of an experimental setup using the GLO-Roots platform is presented in Figure 1.

Figure 1. GLO-Roots growth and imaging system. (A) Three-dimensional representation of the different physical components of the rhizotron, including plastic covers, polycarbonate sheets, spacers, and rubber U-channels. (B) A 35-day-old plant in rhizotron with black covers removed. (C) Top view of holding box with 11 rhizotrons. (D) In-vivo emission spectra of different luciferases used in this study. Transgenic homozygous lines expressing the indicated transgenes were grown on agar media for 8 days. Luciferin (300 μM) was sprayed on the seedlings; plates were kept in the dark and then imaged for 2 sec at wavelengths ranging from 500 to 700 nm. Five intensity values were taken from different parts of the roots of different seedlings and averaged. Relative maximum intensity values are indicated in lower-right graph. (E) GLO1 imaging system composed of two Princeton Instruments PIXIS:2048 back-illuminated CCD cameras (a) cooled down to -55°C. A filter wheel (b) allows spectral separation of the different luciferases. On the right, a rhizotron holder (c) is employed to position the rhizotrons in front of the cameras. A stepper motor (d) rotates the rhizotron 180° to image both sides. (F) A 21 DAS (i.e., 21 days after sowing) plant expressing reporter ProUBQ10:LUC2o was imaged on each of two sides of the rhizotron; luminescence signal is colorized in green or magenta to indicate side. In the middle of the panel, a combined image of the two sides is shown. The inset shows a magnified part of the root system.

Diagrams, photos, and data courtesy of Dr. José Dinneny, Carnegie Institution for Science. First published in R. Rellán-Álvarez et al. 2015. “GLORoots: an imaging platform enabling multidimensional characterization of soil-grown root systems.” eLife 4 (1): e07597.

Whereas most commercially available luminescence imaging systems for biomedical research are optimized for imaging horizontally held specimens or samples in microtiter plates, placing the rhizotrons in this position would induce a gravitropic response in plants. Therefore, GLO-Roots utilizes a custom-designed imaging system (known as the Growth and Luminescence Observatory 1, or simply the GLO1) that has been optimized specifically for imaging dual-reporter luciferase expression in the GLO-Roots rhizotrons.2

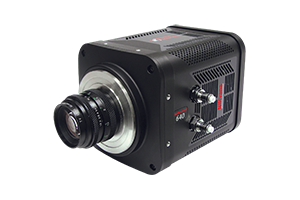
Two PIXIS:2048 back-illuminated CCD cameras from Princeton Instruments are mounted on top of each other so as to capture partially overlapping images of a rhizotron, while a motorized stage automatically rotates the rhizotron to capture images of both sides (refer to Figure 1E). A composite image is then generated from the images captured of each side. Figure 1F shows that approximately half of the root system is revealed on each side, with a few roots being visible on both sides. The soil sheet is thick enough to block light from portions of the root system, yet thin enough to ensure its continuous structure can be compiled from opposite-face views. The entire GLO1 imaging system is enclosed in a light-tight black box that is equipped with a door to permit the loading and unloading of rhizotrons.2

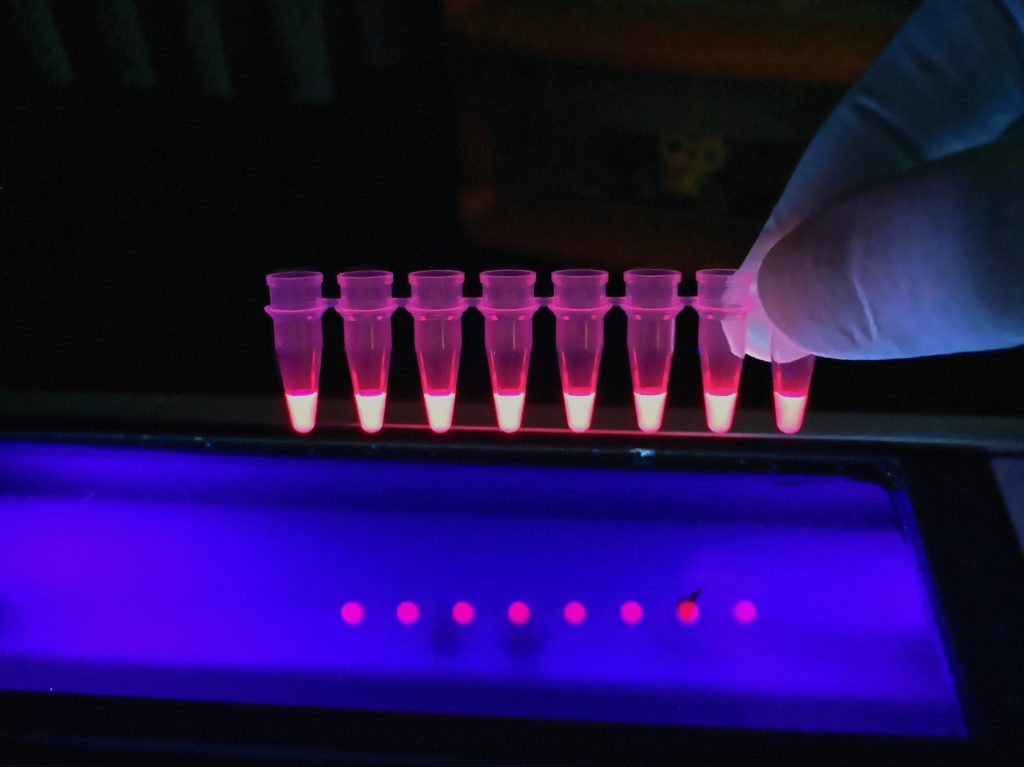
Not only do the PIXIS:2048B cameras afford the GLO-Roots researchers the desired spatial resolution and field of view, but also the excellent low-light-level sensitivity required to detect the emission wavelengths of the different reporters used. Table 1 lists the luciferases employed for the Arabadopsis-related GLO-Roots study.

LuciferaseOriginMaximum Wavelength (nm)Substrate
PpyRE8Firefly618D-luciferin
CBGRedClick Beetle615D-luciferin
Venus-LUC2FP + Firefly580D-luciferin
LUC (+)Fireflu578D-luciferin
CBG99Click Beetle537D-luciferin
Lux operonA. fischeri490Biosynthesis pathway encoded with operon
NanoLUCDeep sea shrimp470Furimazine
Table 1: Seven luciferases were utilized in the published GLO-Roots study involving Arabadopsis. Information courtest of Dr. José Dinneny, Carnegie Institution for Science. First published in R. Rellán-Álvarez et al. 2015. “GLO-Roots: an imaging platform enabling multidimensional characterization of soil-grown root systems.” eLife 4 (1): e07597.

Data and Results

Root systems develop different root types, each of which individually senses myriad local environmental cues and integrates its environment’s information with systemic signals. This highly complex multidimensional amalgam of inputs enables continuous adjustment of root growth rates, direction, and metabolic activity that define a dynamic physical network.2

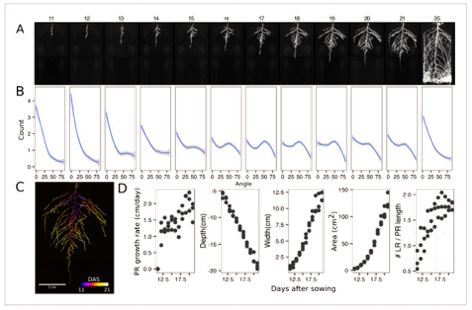
Figure 2 presents time-lapse imaging of Arabidopsis root systems captured with the GLO1 system along with quantification performed using the GLO-RIA image analysis suite.

Figure 2. Time-lapse imaging of Arabidopsis root systems and quantification using GLO-RIA. (A) Typical daily time-lapse image series from 11 to 35 DAS of a ProUBQ10:LUC2o Col-0 plant. (B) Average directionality of three root systems imaged in time series as in panel A calculated using the directionality plug-in implemented in GLO-RIA. (C) Color-coded projection of root growth using the images in panel A. (D) Root system depth, width, and area are automatically calculated from the convex hull, which is semi-automatically determined with GLO-RIA (n = 3). Primary root length, lateral root number, and number of lateral roots divided by the primary root length were quantified manually. A local polynomial regression fitting with 95% confidence interval (gray) was used to represent the directionality distribution curve. 0° is the direction of the gravity vector.

Diagrams, photos, and data courtesy of Dr. José Dinneny, Carnegie Institution for Science. First published in R. Rellán-Álvarez et al. 2015. “GLORoots: an imaging platform enabling multidimensional characterization of soil-grown root systems.” eLife 4 (1): e07597.

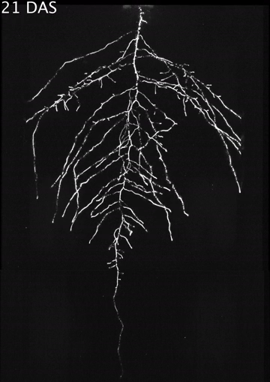
Here, root traits such as directionality can be observed through later stages of plant development (notice the 35 DAS root system image and the 35 DAS directionality analysis shown in Figures 2A and 2B, respectively). A time series spanning 11 to 21 days after sowing Arabadopsis accession Col-0 roots expressing reporter ProUBQ10:LUC2o is presented in Figure 2A and Figure 3; a color-coded time projection is shown in Figure 2C.

Directionality analysis indicates a progressive change in root system angles, from 0° (vertical) to 55°, as lateral roots take over as the predominant root type. Figure 2D shows the evolution over time of several root traits that can be automatically captured by GLO-RIA (depth, width, area) and others that were manually quantified (primary root growth rate or number of lateral roots per primary root.2

To date, the GLO-Roots team has published data pertaining to the continuous imaging of root growth; the root system architecture of different Arabidopsis accessions; the utilization of spectrally distinct luciferases to capture additional information associated with gene expression patterns, characterization of root system interactions, and microbial colonization; adaptive changes in root system architecture under water deficit, phosphorus deficiency, and light; the suitability of the GLO-Roots platform for studying additional plant species; and more. The research team is also highly interested in discovering how other environmental stimuli affect root growth and whether such responses differ between accessions of Arabidopsis.2

Figure 3: Time stamp from video time lapse from 11 to 21 DAS of a Col-0 plant expressing ProUBQ10:LUC2o grown in control conditions. Video courtesy of Dr. José Dinneny, Carnegie Institution for Science. First published in R. Rellán-Álvarez et al. 2015. “GLO-Roots: an imaging platform enabling multidimensional characterization of soil-grown root systems.” eLife 4 (1): e07597.

For more data and an in-depth discussion of results, please refer to R. Rellán-Álvarez et al. 2015. “GLO-Roots: an imaging platform enabling multidimensional characterization of soil-grown root systems.” eLife 4 (1): e07597.

Enabling Technology

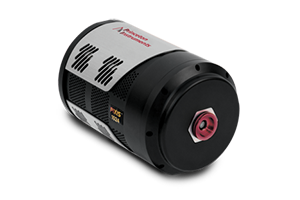
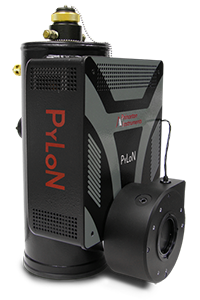
Each of the PIXIS:2048 cameras integrated in the GLO1 imaging system utilizes a CCD featuring a back-illuminated sensor whose large photosensitive array is composed of 2048 x 2048 pixels (see Figure 3). By employing Princeton Instruments’ exclusive XP cooling technology, these four-megapixel cameras achieve thermoelectric cooling down to -70°C via an all-metal, hermetically sealed design. This innovative cooling technology ensures maintenance-free operation and is backed by the industry’s only lifetime vacuum guarantee.

Figure 4: PIXIS:2048 CCD cameras from Princeton Instruments provide superb sensitivity and a large field of view.

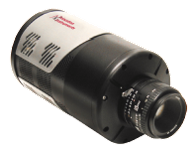
In addition to the XP-facilitated minimization of thermally generated (dark) noise, very high quantum efficiency and ultra-low-noise electronics make PIXIS:2048 cameras ideal for demanding, low-light-level imaging applications. Dual-speed operation (i.e., 100 kHz or 2 MHz) allows utilization in both steady-state and fast-kinetics studies.

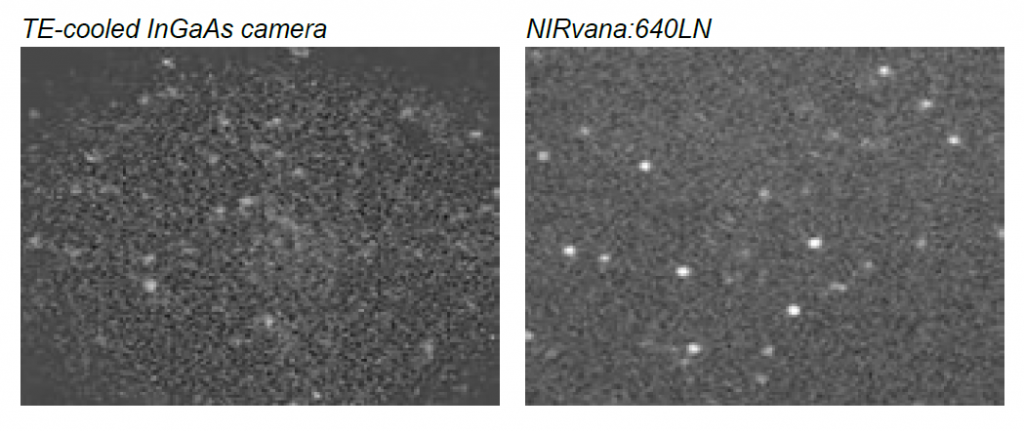
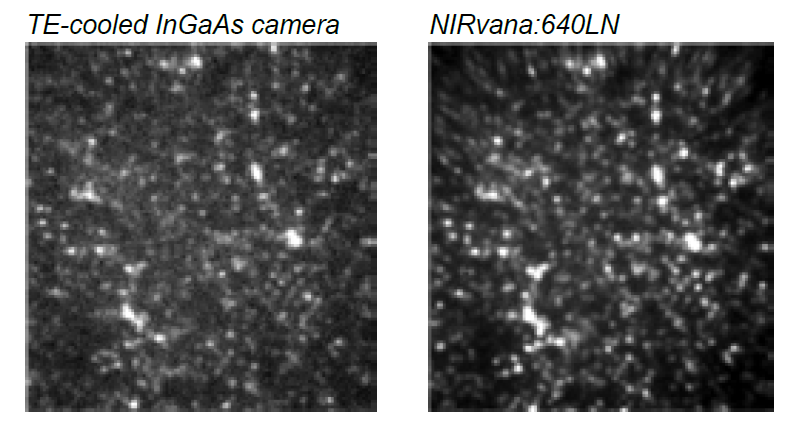
To optimize quantitative scientific imaging performance for applications from the UV to the NIR, the PIXIS:2048 platform supports a front-illuminated CCD format, a back-illuminated format, a back-illuminated format with high UV sensitivity, and a back-illuminated format with high NIR sensitivity (note that Princeton Instruments leverages its own proprietary eXcelon® processing and back-illuminated, deep-depletion technology to deliver the highest sensitivity in the NIR while suppressing the etaloning that occurs in standard back-illuminated CCDs). Several other CCD array sizes, appropriate for various imaging and spectroscopy applications, are supported by the PIXIS series.

Complete control over all PIXIS hardware features is simple with the latest version of Princeton Instruments’ 64-bit LightField® data acquisition software, available as an option. A host of novel functions for easy capture and export of imaging data are provided via the exceptionally intuitive LightField user interface

References

  1. https://dinnenylab.wordpress.com/glo-roots/ [accessed online in May 2016]
  2. R. Rellán-Álvarez et al. 2015. “GLO-Roots: an imaging platform enabling multidimensional characterization of soil-grown root systems.” eLife 4 (1): e07597. doi:10.7554/eLife.07597. http://dx.doi.org/10.7554/eLife.07597.

Further Information

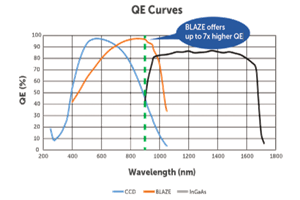
A New Dawn For NIR Spectroscopy

Discover the capabilities of the BLAZE NIR spectroscopy camera, providing the highest near-infrared quantum efficiency, fastest spectral rates, and deepest cooling.

Related Products

Find out our highly sensitive spectroscopy and camera capabilities for fluorescent decay to determine what is right for you.

Get In Touch

Speak to a member of our team about your specific application, and what we can do to help you.

Measuring Spectra of Single Quantum Dot Nanocrystals Emitting in SWIRCustomer Stories

Dr. Han Htoon

MPA-CINT / LANL New Mexico, USA

Background

Dr. Han Htoon is a researcher in the Materials Physics and Applications Division of the Center for Integrated Nanotechnologies (MPACINT), Los Alamos National Laboratory (LANL). The distinguishing characteristic of CINT is its emphasis on exploring the path from scientific discovery to the integration of nanostructures into the micro and macro worlds.

Dr. Htoon’s expertise encompasses many areas of nanophotonics and optical nanomaterials, including low-temperature, single-nanostructure optical spectroscopy and imaging; quantum optical measurements of individual nanostructures; single-nanostructure spectro-electrochemistry experiments; correlated structure, electrical, and optical characterization; magneto-optical spectroscopy; scanning confocal Raman microscopy; and scanning probe microscopy.

Figure 1: Screen shot from blinking movies of single PbS quantum dots emitting at ~1250 nm. Both movies were taken using a two-dimensional InGaAs detection array under the same experimental conditions. Thermoelectrically cooled camera (left) vs. cryogenically cooled NIRvana:640LN (right). Excitation: CW 405 nm. Power density: 3 W/mm2. Integration time: 10 sec. Objective: 50x/0.65NA. Room temperature. Movies courtesy of Dr. Han Htoon, MPA-CINT / LANL.

Challenge

Recently, Dr. Htoon’s group at CINT utilized a NIRvana®:640LN camera from Princeton Instruments to perform single-nanocrystal
spectroscopy for PbS quantum dots emitting at ~1250 nm.

Dr. Htoon’s group is the first to report single-nanocrystal spectral studies for this type of quantum dot with emission in the shortwave
infrared (SWIR) region. Their work will benefit the understanding and development of SWIR semiconductor nanocrystals for applications ranging from human health to national defense.


Figure 2: Images of the same region of a concentrated PbS quantum dots sample. Both images were taken using a two-dimensional InGaAs detection array under the same experimental conditions. Thermoelectrically cooled camera (left) vs. cryogenically cooled NIRvana:640LN (right). Excitation:CW 405 nm. Power density: 3 W/mm2. Integration time: 10 sec. Objective: 50x/0.65NA. Room temperature. Images courtesy of Dr. Han Htoon, MPA-CINT / LANL.

The unprecedented long integration times and low dark counts [of the NIRvana:640LN] enabled single-nanocrystal spectral experiments, which cannot be achieved with conventional InGaAs detectors for these dots

Solution

For the PbS quantum dot study, a NIRvana:640LN camera featuring a two-dimensional InGaAs focal plane array capable of being cooled down to 83 K (-190°C) via liquid nitrogen was coupled to a Princeton Instruments IsoPlane® 320 imaging spectrograph.

According to Dr. Htoon, the cryogenically cooled NIRvana camera’s unprecedented long integration times and low dark counts enabled
the groundbreaking single-nanocrystal spectral experiments by providing levels of contrast and sensitivity that cannot be achieved with other InGaAs cameras when working with these quantum dots (see Figure 1 and Figure 2).


Understanding Soot Formation in Combustion FlamesResearch Stories

Frederic Griesch

Proceedings of the Combustion Institute

On the use of PIV, LII, PAH-PLIF and OH-PLIF for the study of soot formation and flame structure in a swirl stratified premixed ethylene/air flame

Introduction

Frederic Griesch and his colleagues from the CORIA research institute in France try to understand the formation soot particles in combustion flames. They use emICCD cameras for in situ observation of laser induced fluorescence of OH and aromatic molecules and laser induced incandescence to monitor soot particles.

In their article the researchers from France describe that there is significant environmental impact of soot particles produced in combustion processes although it has been underestimated for a long time. Areas that rely on combustion processes, for example the aviation industry, will likely face increased standards that require the development of cleaner combustion engines that reduce fuel consumption and soot production.

Soot particles of 10-50 nm diameter can form in a nucleation process starting from polycyclic aromatic hydrocarbon molecules (PAHs) that are produced by chemical decomposition of fuel during the combustion reaction. To better understand the soot formation process the researchers use optical imaging techniques to simultaneously observe OH molecules, PAH molecules using planar laser induced fluorescence (PLIF) and soot using laser induced incandescence (LII). OH is an abundant molecule in the reaction region of flames and is observed to determine the location of the reaction front in the flame.

PLIF measures the fluorescent emission from molecules that are excited to a higher electronic state by a laser. For PLIF measurements the researchers create a thin light sheet from an ultrashort laser pulse using cylindrical lenses. The PLIF signal is observed perpendicular to the laser sheet on a PI-MAX4 emICCD camera with a 15 nm bandpass filter centered 315 to select the emission of OH molecules. The emICCD is synchronized with the laser and operated around 50 ns gate width. The short gate times make sure that the very short PLIF signal is detected while the background light from the flame is suppressed. Similarly, the PLIF signal from PAHs is selected on a second PI-MAX4 emICCD camera using filters to only detect emission above 325 nm.

LII measures the thermal emission from the soot particles that are heated by the ultrashort laser pulse. The LII signal is detected on the same camera as the PAH-PLIF signal using 100 ns gate width.

The laser induced measurements are combined with particle image velocimetry measurements to illuminate the aerodynamic processes of the combustion reaction.

The multichannel, simultaneous optical imaging technique is successfully applied to characterize the soot formation mechanisms in a combustion flame and will be useful for future investigations of soot formation.

Further Information

Metallic Nanoparticles With Plasmon Resonance
For TherapeuticsResearch Stories

Emilie Ringe

Nano Letters

Magnesium Nanoparticle Plasmonics

Introduction

Researchers around Emilie Ringe from Rice University (US) and Cambridge University (UK) are reporting on their experiments investigating localized surface plasmon resonance in magnesium (Mg) nanoplatelets synthesized by their group.

Metallic nanoparticles that show plasmon resonance effects are being investigated for potential applications such as cancer therapy, (bio-)sensing, and enhanced spectroscopy. The plasmon resonance leads to increased electric field effects and enhanced scattering enabling high sensitivity sensing.

The researchers investigate Mg as it is more abundant than nanostructures based on Au or Ag. Among several characterization methods, optical darkfield scattering spectroscopy is important to confirm response of the platelets in the UV, VIS and NIR wavelength ranges.

Further Information

Oxygen Biosensing Using FLIM and ICCDsResearch Stories

Xu-dong Wang

Analytical Chemistry

Luminescent silica nanosensors for lifetime based imaging of intracellular oxygen with millisecond time resolution

Introduction

When environment parameters on the micro- and nanoscale need to be measured, optical methods can be applied in-situ and without interfering with the system under study. For addressing specific properties fluorescent nanoparticles are attractive for uses in environment and bio-sensing.

Specifically, looking at fluorescent bio- and nanosensors the signal acquisition can utilize the quenching of the fluorescent signal (or change in its intensity), a shift in the wavelength of the fluorescent emission or changes in the fluorescent decay lifetime. The nanosensors have to be the right size and have chemical and physical properties to work in their targeted environment.

Researchers around Xu-dong Wang from Fudan University in China just published a paper where they describe measurements of oxygen in cells using fluorescent, functionalized nanoparticles and a fast system for fluorescent (or phsophorecent) lifetime imaging (FLIM or PLIM). Oxygen obviously plays a fundamental role in the cells metabolism and precise measurements give new insights into the workings of cells that can be used in biology and medical applications.

The experiments relied on nanoparticles with changing fluorescent decay times in the presence of oxygen. The FLIM setup is realized using a pulsed laser, microscope and a PI-MAX4-1024i camera. This setup allows for rapid measurements of fluorescent decay times using a rapid lifetime determination (RLD) algorithm utilizing a measurement scheme of overlapping gates. More details on the RLD algorithm are described in a PI app note (Novel Time-Resolved FLIM Measurements Method).

The researchers found that this method is orders of magnitudes faster and has similar accuracy than using methods relying on time correlated single photon counting (TCSPC) that need to scan an image point by point. The analysis for the RLD algorithm for single exponential decays has actually been implemented for this group by our TPI China team directly in LightField using the LightField formulas.

Further Information

Real-Time Imaging of Singlet Oxygen via MicrospectroscopyApplication Notes

New Two-Dimensional InGaAs Detector Thermoelectrically Cooled to –85°C
Facilitates Scientific Research

Introduction

Molecular oxygen is one of the most important molecules in maintaining life as well as in mechanisms by which life is extinguished and materials destroyed. For several decades, researchers have been intrigued by the physical and chemical properties of molecular oxygen’s lowest excited state, singlet oxygen (1O2). In particular, singlet oxygen has a unique reactivity that can result in polymer degradation or the death of biological cells. Its role as an intermediate in cell death is exploited by photodynamic therapy (PDT) for cancer, a technique in which light is utilized as a medical tool1,2.

In PDT, a photosensitizer (PS) is incorporated into abnormal tissues and then irradiated with visible light so that it transfers energy to ground-state oxygen via the type II photochemical pathway, producing singlet oxygen (which can be directly detected by its weak 1270 nm emission)3. Owing to the special interest in elucidating the biochemical action of singlet oxygen on the subcellular level, several high-spatial-resolution methods have been proposed to detect 1O2 luminescence using either a single photomultiplier tube (PMT), a linear InGaAs detector array, or a two-dimensional InGaAs detector3.

In this application note, a novel microspectroscopy setup that uses a NIRvana:640 InGaAs camera from Princeton Instruments is evaluated by Dr. Marek Scholz of Charles University (Prague, Czech Republic). Dr. Scholz reports that the new NIRvana® camera’s two-dimensional InGaAs array has allowed himself and fellow members of the Optical Spectroscopy Group headed by Prof. Jan Hála to address the issue of potential spectral overlap of 1O2 phosphorescence with the NIR-extended luminescence of the PS, thus providing an effective means of distinguishing and separating them for the first time4.

Experimental Setup

The experimental setup utilizes two detection channels (VIS and NIR) to perform real-time imaging of the very weak near-infrared phosphorescence of singlet oxygen and photosensitizer simultaneously with the visible fluorescence of the photosensitizer. This innovative setup (see Figure 1) enables acquisition of spectral images based on singlet oxygen and photosensitizer luminescence from individual cells. One dimension of the image is spatial and the other is spectral, covering a spectral range from 500 to 1700 nm.

Figure1: NIR luminescence microspectroscopy setup: lower portion of diagram depicts spectral regions detected by VIS and NIR paths.
DOI: 10.1039/c4pp00121d – Reproduced by permission of The Royal Society of Chemistry (RSC) on behalf of the European Society for Photobiology, the European Potochemistry Association, and RSC. http://pubs.rsc.org/en/content/articlelanding/2014/pp/c4pp00121d#!divAbstract

The direct, real-time imaging setup, as illustrated in Figure 1, is built around an Olympus inverted fluorescence light microscope and uses a 405 nm constant-wavelength (CW) laser as an excitation source. The laser beam is passed through neutral-density (ND) filters and coupled by a 500 nm dichroic longpass mirror (DLP) into an NIR-corrected objective (OBJ). The illuminated spot on the sample (S) is enlarged to about 94 µm by inserting a lens (L1) in the excitation path. To direct the luminescence emission collected by the objective from the sample to an NIR path for detection, a golden mirror (GM) is inserted. Removing the mirror directs the emission to a VIS path.

In the NIR path, the signal passes through a combination of NIR longpass and shortpass filters (F); the filter combination depends on the specific experiment. The signal is then focused by an achromatic lens (L2, f = 20 cm) onto the entrance slit of an Acton SpectraPro® 2500i imaging spectrograph from Princeton Instruments. The spectrograph is coupled to a NIRvana:640 InGaAs camera, also from Princeton Instruments (see Figure 2). To reduce dark charge, the camera’s NIR-sensitive, two-dimensional focal plane array (FPA) is cooled to −80°C.

Figure 2: The NIR path of the experimental set up includes a Princeton Instruments NIRvana:640 two-dimensional InGaAs detector coupled to a SpectraPro 2500i imaging spectrograph. Photo courtesy of Dr. Marek Scholz, Charles University

The 2500i spectrograph is configured either with a grating (150 g/mm, 1.2 µm blazed) for spectroscopy or a mirror for imaging. To minimize sample photobleaching, the shutter (SH) in the excitation path is controlled by the NIRvana camera and opened only during exposure times. In the imaging mode, the area of 0.34 x 0.34 μm on the sample is magnified to the 20 x 20 µm pixel size of the NIRvana’s FPA, which corresponds to 58x magnification. At 1275 nm (1O2 phosphorescence band), the spatial resolution due to the diffraction limit is about 1.4 µm, according to the Rayleigh criterion, as determined by the objective numerical aperture of 0.55. In the spectroscopy mode, the spectral resolution of the system, determined by the width of the entrance slit of the spectrograph, is 10 nm.

Alternatively, in the VIS path, a Spec-10:400B back-illuminated CCD camera from Princeton Instruments is coupled to an Acton SpectraPro 2300i imaging spectrograph. Recently, to simultaneously detect VIS and NIR spectral regions, the setup was modified by replacing the golden mirror with a shortpass dichroic mirror (DM). The original set of filters has also been modified. Refer to Scholz et al. 2014 for further details regarding the experimental setup.

Results and Conclusions

The introduction of the spectral imaging method provides a powerful new tool for distinguishing and separating potential spectral overlap of 1O2 phosphorescence with the NIR-extended luminescence of the photosensitizer. It can be applied to any PS manifesting NIR luminescence. Some of the data is presented below; more can be found in Scholz et al. 2014

The images displayed in Figure 3A were captured while continuously irradiating a cell, incubated for 5 hours with 100 μM TMPyP in a D2O-based saline solution, with 1 W/cm2 laser power. The >1250 nm image (using a combination of 850 and 1250 nm longpass filters) was obtained by adding the last four frames (i.e., a total of 20 sec exposure) from a series of
10 consecutive frames with exposure times of 5 sec each. Subsequently, a spectral image was obtained with a 25 sec exposure. The brightfield and fluorescence images were taken afterward. The spectrum shows that 1O2 phosphorescence is the dominant spectral feature. For different cells, it was verified that when a 1350 nm longpass filter was used in place of the
1250 nm longpass filter, the >1250 nm image intensity dropped by more than 70%.

Figure 3: NIR luminescence-based images and spectra accompanied by brightfield and VIS fluorescence-based images of 3T3 mouse fibroblasts incubated for 5 hours with 100 μM TMPyP in a D2 O-based saline solution. Frames A and B represent two different samples. The green rectangles are defined by the entrance slit of the spectrographs and represent the areas from which the spectral images were collected. The graphs of spectra were obtained by vertical binning of the spectral images. A Gaussian blur filter with unit radius was applied to smooth the spectral image in order to make weak spectral features more distinguishable.

DOI: 10.1039/c4pp00121d – Reproduced by permission of The Royal Society of Chemistry (RSC) on behalf of the European Society for Photobiology, the European Photochemistry Association, and RSC. http://pubs.rsc.org/en/content/articlelanding/2014/pp/c4pp00121d#!divAbstract

The images displayed in Figure 3B were captured from different cells incubated using the same procedure. Four near-infrared images were taken by irradiating these cells with 2.5 W/cm2 laser power. First, the 850–1100 nm image (I1) using a combination of 850 nm longpass and 1100 nm shortpass filters was acquired with a 1 sec exposure. Next, the >1250 nm image (I2) was taken with a 5 sec exposure. Afterward, the ‘850–1100 nm + NaN3’ image (I3) with a 1 sec exposure and the ‘>1250 nm + NaN3’ image (I4) with a 5 sec exposure were acquired after adding an aliquot of 10 mM NaN3 to the sample, gently stirring it, and then leaving it in the dark for 5 minutes. A slight drop in the 850–1100 nm signal was observed, which is likely indicative of a certain level of photobleaching. In the >1250 nm image (I4), however, a much larger drop in signal was observed after the addition of the NaN3. The 1O2 signal is assumed to be almost totally quenched in the I4 image, which is formed predominantly by the NIR background luminescence of the TMPyP. A combination of these four images I1–I1 allows the researchers to reconstruct the true image of 1O2 luminescence

This new experimental setup, which employs an NIR-sensitive, two-dimensional InGaAs focal plane array as a detector, has proven sufficiently sensitive to yield 1O2 images and spectral images of individual D2O-treated fibroblast cells incubated with TMPyP. The setup’s overall efficiency for 1O2 phosphorescence detection was estimated to be 1–3%. The primary limiting factor was determined to be the numerical aperture of the objective (N.A. = 0.55).

Enabling Technology

The main advantage of the NIRvana:640 camera (see Figure 4) over previously utilized 1D InGaAs detectors, according to Dr. Scholz, is the NIRvana detection array’s two-dimensionality, which leads to a dramatic reduction of acquisition times and avoids some of the problems caused by photobleaching of the sample.

NIRvana photo
Figure 4: The Princeton Instruments NIRvana:640 camera features a two-dimensional InGaAs detection array that can be thermoelectrically cooled as low as -85°C

The NIRvana:640 has been specially designed by Princeton Instruments for scientific research applications requiring superb linearity and excellent near-infrared sensitivity. Its 640 x 512 InGaAs detection array, which delivers response from 0.9 µm to 1.7 µm, can be thermoelectrically cooled as low as –85°C in order to minimize thermally generated noise and improve signal-to-noise ratio.

Seeking to quantify performance parameters for their new microspectroscopy setup, the Prague group conducted an experiment to determine the dark noise of the NIRvana:640 (at −80°C). The results are presented in Figure 5.

Figure 5: Dark counts per pixel and standard deviation for different exposure times per frame (NIRvana640 camera).

DOI: 10.1039/c4pp00121d – Reproduced by permission of The Royal Society of Chemistry (RSC) on behalf of the European Society for Photobiology, the European Photochemistry Association, and RSC. http://pubs.rsc.org/en/content/articlelanding/2014/pp/c4pp00121d#!divAbstract

The NIRvana:640 InGaAs camera also provides 16-bit digitization and low read noise for outstanding dynamic range. Furthermore, the latest Princeton Instruments LightField® 64-bit data acquisition software, available as an option, affords complete control over all NIRvana hardware features via an exceptionally intuitive user interface. LightField provides automatic defect correction, precision exposure control, and a host of innovative functions for easy capture and export of imaging and spectral data.

Summary

Singlet oxygen, the first excited state of molecular oxygen, is a highly reactive species that plays an important role in a wide range of biological processes, including cell signaling, immune response, macromolecule degradation, and elimination of neoplastic tissue during photodynamic therapy4. Often, a photosensitizing process is employed to produce singlet
oxygen from ground-state oxygen.

An innovative experimental setup developed and used at Charles University in Prague now permits researchers to perform direct, real-time imaging of singlet oxygen while addressing the issue of potential spectral overlap with emitted light from the photosensitizing agent. This fastdata-acquisition microspectroscopy setup relies on the two-dimensional array and exceptional near-infrared sensitivity of the Princeton Instruments NIRvana:640 InGaAs detector.

References

  1. Schweitzer C. and Schmidt R. Physical mechanisms of generation and deactivation of singlet oxygen. Chem. Rev. 103, 1685–1757 (2003).
  2. Skovsen, E. Progress report: Non-linear two-photon singlet oxygen emission microscopy. Department of Chemistry, University of Aarhus, Denmark (2004).
  3. Hu B., He Y., and Liu Z. NIR area array CCD-based singlet oxygen luminescence imaging for photodynamic therapy. Journal of Physics: Conference Series 277 (2011).
  4. Scholz M., Dědic R., Valenta J., Breitenbach T., and Hála J. Real-time luminescence microspectroscopy monitoring of singlet oxygen in individual cells. Photo

Further Information

NIRvana camera photo

Related Products

Overview of the advantages of the products available which are optimized for singlet oxygen applications.

Get In Touch

Speak to a member of our team about your specific application, and what we can do to help you.

Join Our Mailing List

Want to be up to date on the latest offers and news from Teledyne Princeton Instruments? Join our mailing list today.

High-Sensitivity Imaging of Time-Domain NIR Light TransducerResearch Stories

Fuyou Li

Nature Photonics

High-sensitivity imaging of time-domain near-infrared light transducer

Introduction

Researchers from Fudan University are using a new type of fluorescent probe for in-vivo imaging applications. As NIR-II/SWIR imaging applications are on the rise most often spectral, fluorescent probes are being used. That means that excitation light of one wavelength is converted into spectrally shifted emission.

This is done for 2 reasons: first the emission is shifted to the low scattering and low absorption window in the SWIR wavelength range and second the emission can be spectrally separated from the intense excitation using optical bandpass or longpass filters.

The researchers from China compare this to a different approach. They are using the temporal shift between excitation and fluorescent emission and use very sensitive emICCD cameras (PI-MAX4) to separate the signals.

Although the outcomes can still be improved (high scattering and low quantum efficiency of detection of gate cameras in the NIR range) they see great potential in this approach due to the high brightness of the temporal nanoprobes.

Further Information

Blood Glucose Observation Using In vivo Raman SpectroscopyResearch Stories

Jeon Toong Kang, Peter So

Science Advances

Direct observation of glucose fingerprint using in vivo Raman spectroscopy

Introduction

Non-invasive, optical detection of blood glucose levels would greatly enhance the comfort of diabetes patients, who typically have to monitor glucose levels daily. A recent publication from researchers at MIT (Cambridge, MA, USA) and Samsung (Korea), showcased in Science Advances, confirms that Raman spectroscopy can be used to measure glucose from the skin.

The publication demonstrates, for the first-time, glucose-specific Raman features from in vivo skin samples and describes the data analysis model for glucose concentration prediction from single shot and difference Raman measurements.

The collection of the Raman scattered light was optimized by using a custom 61 fiber bundle and a high throughput LS-785 spectrograph. For the system to detect the large fiber bundle, a tall PIXIS-1024BRX camera was required. To ensure optimization via strong signal creation, the new experiment setup uses an off-axis excitation (830 nm) and signal collection configuration all while minimizing unwanted background signal.

Using this system, the researchers will be able to collect baseline measurements for the development of improved, miniaturized Raman systems and strong prediction algorithms for future use with human patients.

Further Information

Microspectroscopy for Studying the Surfaces of Individual NanoparticlesCustomer Stories

Dr. Han Htoon

MPA-CINT / LANL New Mexico, USA

Background

Dr. Han Htoon is a researcher in the Materials Physics and Applications Division of the Center for Integrated Nanotechnologies (MPACINT), Los Alamos National Laboratory (LANL). The distinguishing characteristic of CINT is its emphasis on exploring the path from scientific discovery to the integration of nanostructures into the micro and macro worlds.

Dr. Htoon’s expertise encompasses many areas of nanophotonics and optical nanomaterials, including low-temperature, single-nanostructure optical spectroscopy and imaging; quantum optical measurements of individual nanostructures; single-nanostructure spectro-electrochemistry experiments; correlated structure, electrical, and optical characterization; magneto-optical spectroscopy; scanning confocal Raman microscopy; and scanning probe microscopy.

Figure 1 : An image of the custom built microspectroscopy system, comprised of the IsoPlane and PIXIS CCD camera attached to an optical microscope. The spectrum shows the redshift of the longitudinal surface plasmon resonance peak of an individual gold nanorod upon reacting with 1 mM cysteamine.

Challenge

Recently, Dr. Htoon’s group at CINT utilized a NIRvana®:640LN camera from Princeton Instruments to perform single-nanocrystal
spectroscopy for PbS quantum dots emitting at ~1250 nm.

Dr. Htoon’s group is the first to report single-nanocrystal spectral studies for this type of quantum dot with emission in the shortwave
infrared (SWIR) region. Their work will benefit the understanding and development of SWIR semiconductor nanocrystals for applications ranging from human health to national defense.


The unprecedented long integration times and low dark counts [of the NIRvana:640LN] enabled single-nanocrystal spectral experiments, which cannot be achieved with conventional InGaAs detectors for these dots

Solution

For the PbS quantum dot study, a NIRvana:640LN camera featuring a two-dimensional InGaAs focal plane array capable of being cooled down to 83 K (-190°C) via liquid nitrogen was coupled to a Princeton Instruments IsoPlane® 320 imaging spectrograph.

According to Dr. Htoon, the cryogenically cooled NIRvana camera’s unprecedented long integration times and low dark counts enabled
the groundbreaking single-nanocrystal spectral experiments by providing levels of contrast and sensitivity that cannot be achieved with other InGaAs cameras when working with these quantum dots (see Figure 1 and Figure 2).


Revealing the Influence of Algae on the Surface of SeawaterResearch Stories

Mickey Rogers

ChemRxiv

The Ocean’s Elevator: Evolution of the Air-Seawater Interface During a Small-Scale Algal Bloom

Sum Frequency Generation Spectroscopy helps to understand the structure of molecules on the interface between air and seawater.

The vast majority of the surface of the earth is covered by oceans. It is known that the exchange of gas and materials between air and seawater can have important effects not only on the marine ecosystem, but also on the climate on global scales. Investigating and understanding the physics and chemistry at the interface between air and sea enables us to better understand the processes involved in gas and material exchanges and can have an important role in correctly modelling the influence of the oceans on the global climate.

Prof. Heather Allen from Ohio State University in Columbus, Ohio, and her research group investigate the physical and chemical properties of water and interfaces using imaging and spectroscopy, such as Raman spectroscopy, and non-linear techniques like sum frequency and second harmonic generation spectroscopy.

In this publication the Allen lab reports on experiments investigating the interface between sea water and air with imaging, and vibrational and non-linear spectroscopy. Specifically, the group looks at changing properties of the surface during growth of marine algae and tracks its effects over time.

One measurement technique used by the group is sum frequency generation spectroscopy, which is a non-linear process that is frequently used in the investigation of surfaces and interfaces. The sum-frequency signal can only be generated when inversion symmetry is broken and therefore this technique is very useful in studying the molecular composition and structure of thin layers of molecules on surfaces.

The Allen group combines a short pulsed visible and tunable IR beam on the air-water interface controlling their polarization and uses a sensitive, aberration corrected spectrograph with a liquid nitrogen cooled CCD (IsoPlane SCT-320 and Pylon-400) for detection. As the second order sum-frequency signal can be weak, this combination provides sensitive and low noise detection, which is important for reliable, quantitative measurements.

The sum-frequency signal shows spectral features that originate from population of dangling OH molecules and their stretching motion as well as broad bands due to the “hydrogen bonding network of interfacial water“. The researchers monitor the spectral features over time during the growth of the marine algae population and attribute the changes in the spectral features to the binding of water with biological, organic material produced by the algae.

Further Information