Elizabeth Vargis, Ph.D. and Anita Mahadevan-Jansen, Ph.D.
Department of Biomedical Engineering
Vanderbilt University
Introduction
Accurate, rapid and non-invasive detection and diagnosis of malignant disease in tissues is an important goal of biomedical research. Optical methods, such as diffuse reflectance, fluorescence spectroscopy, and Raman spectroscopy, have all been investigated as ways to attain this goal. Diffuse reflectance utilizes the absorption and scattering properties of tissues, particularly from cell nuclei and stroma. Changes in the scattering properties of tissues arise as the tissue becomes more dysplastic1, 2 due to variations in hemoglobin content3 and neovascularization4. Fluorescence spectroscopy is also influenced by the changes in the optical properties of tissues and has been used to diagnose dysplasia.5,6.7,8 However, there are a number of disadvantages to these techniques, including the need for extensive sample preparation or excision, as well as low sensitivity and specificity rates.6,9
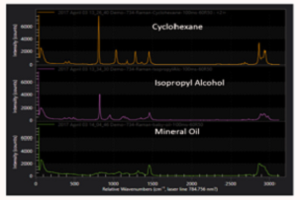
Many research groups have instead used Raman spectroscopy to detect and diagnose disease in vivo without the need for tissue removal or the addition of exogenous agents. Raman spectroscopy, a method based on Raman scattering, is a powerful technique that can be applied to many tissue sites. Raman spectroscopy is a molecular-specific technique that probes the vibrational or rotational transitions in chemical bonds and provides detailed information about the biochemical composition of a sample.10 The sensitivity of this technique is so high that a Raman spectrum is effectively a precise fingerprint of the biochemical makeup of the tissue.
A probe-based Raman spectroscopy system has been developed to non-invasively obtain Raman spectra in vivo for our research. The overarching goals of our group are to use Raman spectroscopy to successfully detect and diagnose abnormal tissues regardless of a patient’s age, race, body mass index (BMI), or medical history. Nearly identical systems have been set up to acquire Raman data to study a variety of malignancies, such as cervical dysplasia, changes indicative of preterm labor in the cervix, skin cancer, colon cancer, and breast tumor margins. After acquisition, Raman spectra are calibrated to account for day to day variations and processed to subtract background fluorescence and smooth noise. Lastly, statistical analyses are performed to determine if Raman spectroscopy is capable of diagnosing malignant areas.
Setup and Methods
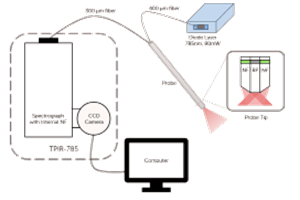
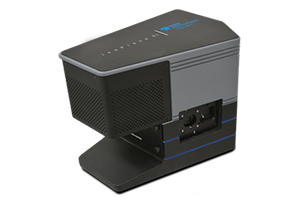
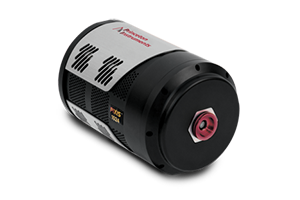
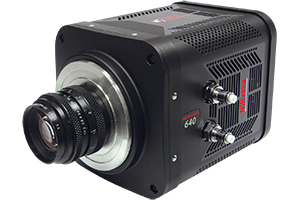
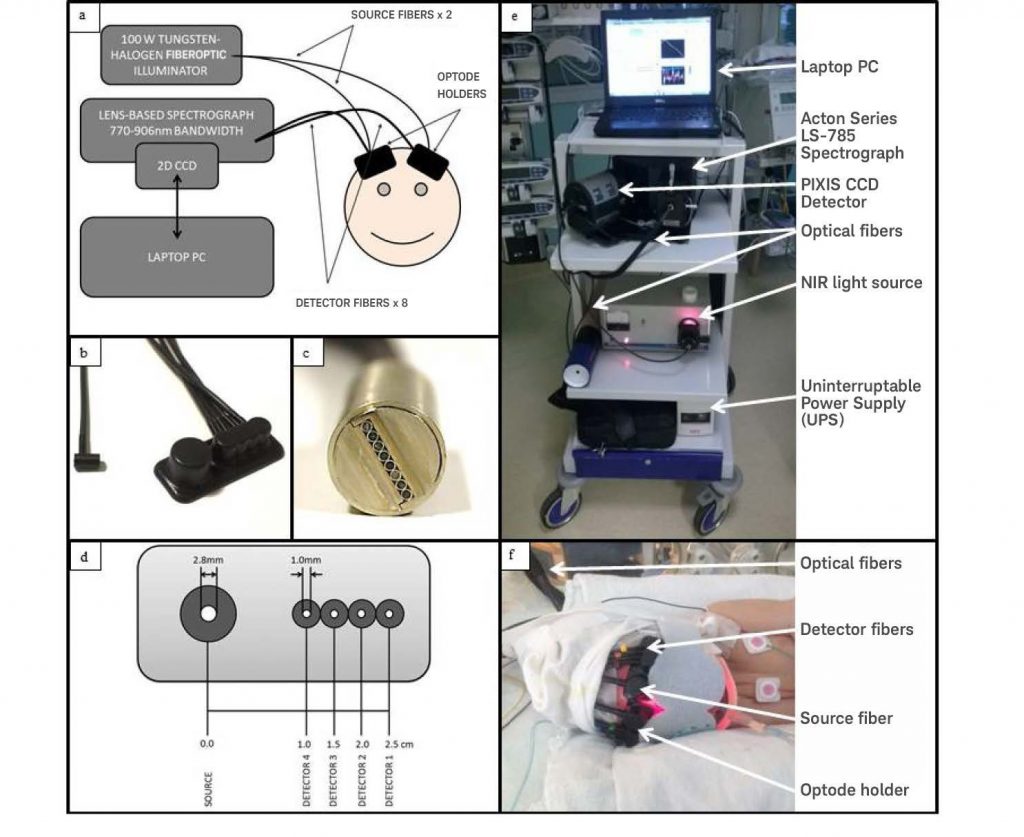
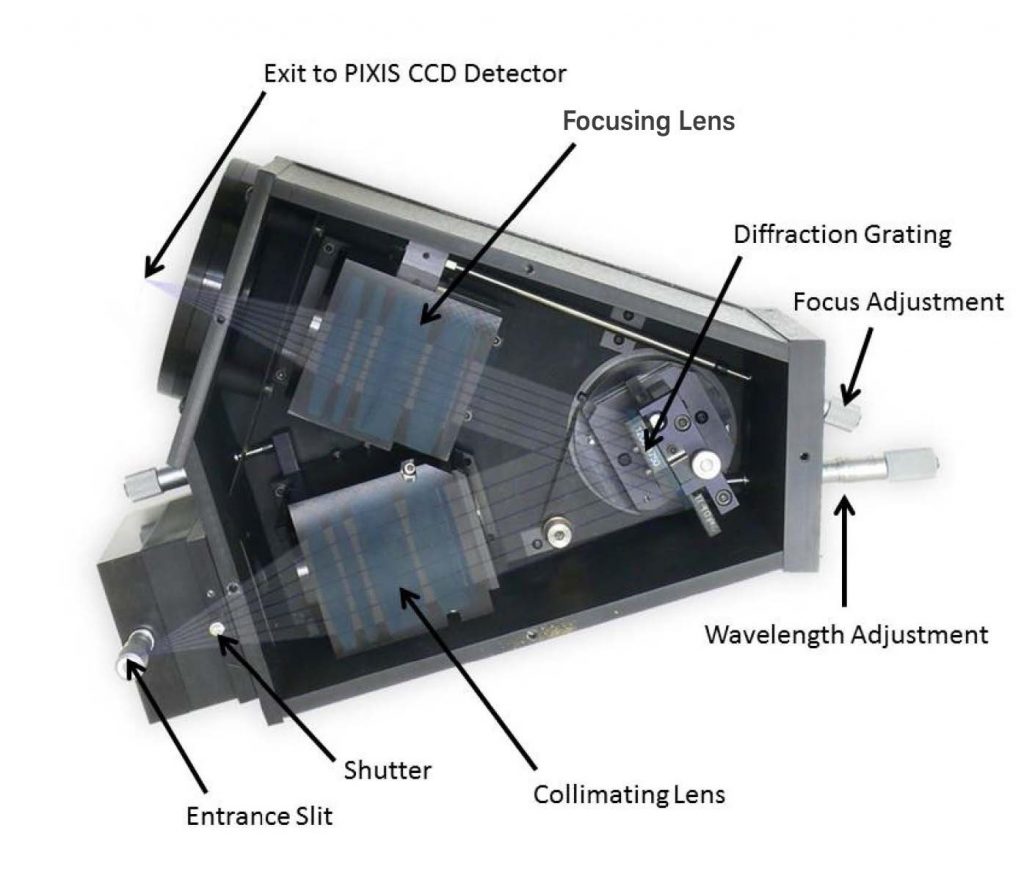
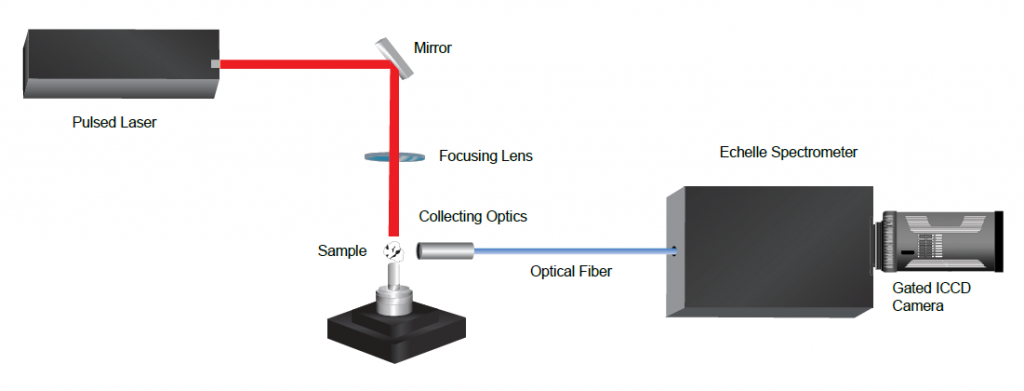
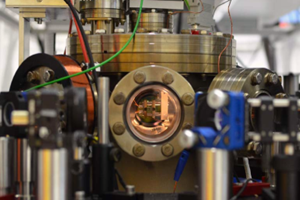
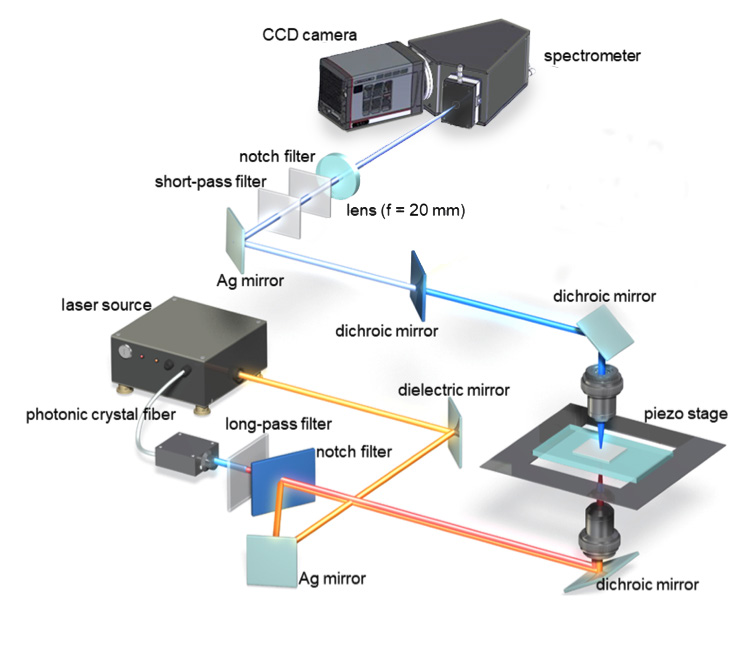
A schematic and picture of one experimental setup is shown in Figure 1. It consists of an EMVision fiber optic probe connected to a 785 nm diode laser (from Process Instruments, Inc. or Innovative Photonics Solutions), a Kaiser Optical Systems imaging spectrograph (Holospec, f/1.8i-NIR) and a back-illuminated, deep-depletion, thermo-electrically cooled Princeton Instruments CCD camera (PIXIS 256BR). These systems are all controlled with a laptop computer using software provided by Princeton Instruments (Winspec). In most experimental protocols, the fiber optic probe delivers between 80 and 100 mW of light onto the tissue with an integration time between 2-5 seconds. During the measurements, all room lights and the computer monitor are turned off. A spectral resolution of 8 wave numbers (cm-1) is achieved.
For these studies, 7-around-1 fiber optic probes have been developed. The excitation fiber is 400 μm in diameter and each collection fiber is 300 μm in diameter. The following is a typical protocol for acquiring Raman data. First, the area of interrogation is cleaned with a dry swab and then with saline. After the lights are turned off, the Raman probe is placed on the area and a measurement is taken. When all of the measurements are complete, the probe is wiped off, placed in a 10% bleach solution for at least 10 minutes and then placed in deionized water for 5-10 minutes.
In general, the protocol for acquiring Raman spectra is determined by the goals of the study. For our cervical dysplasia study, data are acquired from two sets of patient groups: 1) a mostly normal population who come to the clinic for screening and 2) a diseased population who come to the clinic for disease diagnosis. In the first patient group, the cervix is cleaned and Raman spectra are then acquired from three areas of the cervix. The spectra are correlated with the resulting pathology report, which can be normal, atypical cells, low-grade dysplasia, or highgrade dysplasia. In the second patient group, the patient has already been screened for cervical dysplasia and has either atypical cells, low-grade or high-grade dysplasia.
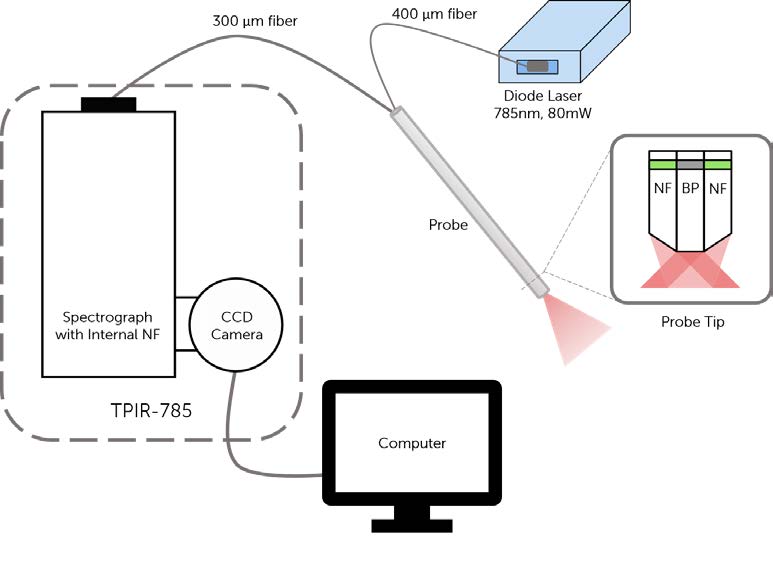
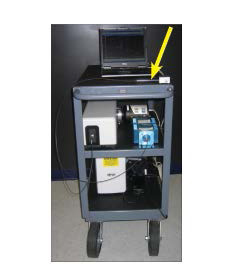
Figure 1: a) Illustration of in vivo Raman spectroscopy setup, including the diode laser, probe (with details of probe tip), spectrograph and CCD camera. b) Photo of system on cart, ready for use in the clinic. Note the yellow arrow pointing to the probe.
During this visit, acetic acid is placed on the cervix, turning any abnormal areas white. The Raman spectra are then acquired from any area the medical provider decides to biopsy as well as one visually normal area. The biopsy is then performed. The pathology results from this procedure are negative, inflammation/metaplasia, cervical intraepithelial neoplasia grades I-III (CIN I-III), or carcinoma-in-situ (CIS).
The Raman data are then calibrated and processed to subtract background fluorescence and smooth noise. These methods have been described previously.11 In the case of cervical dysplasia detection, sparse multinomial logistic regression (SMLR) is used to classify spectra from each patient as normal, benign, low-grade (CIN I) or high-grade (CIN II or III).12 Briefly, SMLR is a Bayesian machine-learning framework that computes the posterior probability of a spectrum belonging to each tissue class based on a labeled training set. A composite spectrum averaging Raman measurements from each patient are used for group 1. For the second group, each individual spectrum was used, as they are acquired from distinct sites that can be matched to a specific pathology report.
Results and Discussion
Detecting cervical dysplasia using Raman spectroscopy has been an ongoing study of our lab. In our initial studies, spectra were acquired from the cervix of patients undergoing a total hysterectomy for either benign or malignant conditions. In those studies, Raman spectra were classified as normal, benign or malignant with a sensitivity of 89% and a specificity of 81%. Although these results are similar to those found when using standard clinical techniques, they did not provide enough proof that Raman spectroscopy can successfully diagnose cervical dysplasia and be easily implemented within the clinic.
More recently, we have been collecting data as described above in the Setup and Methods section, which had led to measurements from over 500 patients. In the first set of studies, spectra were acquired from the two patient groups and classified with over 88% accuracy.13 While these results were still not clinically applicable, the methods used to classify the data (SMLR) showed that there was a large amount of variance among the normal data.
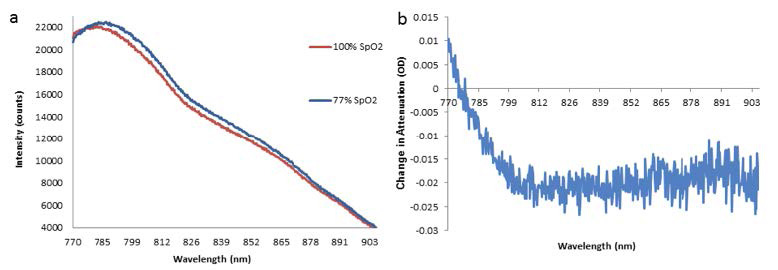
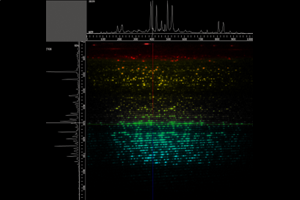
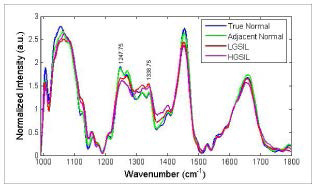
Further studies have focused on finding sources of this variance and examining whether they affect the classification of disease spectra. For example, our previous work has shown that differences may be due to variations resulting from hormonal levels present during a normal menstrual cycle and before and after menopause.14 Also, the presence of disease permanently alters the cervix and thus the Raman spectra acquired from it (Figure 2). Incorporating these results into the SMLR algorithm prior to disease classification increased the classification accuracy to 94% and 97% in each study.
Currently, we are looking at variations that may be caused by ethnicity, parity, socioeconomic status and BMI. Our initial results have demonstrated that parity, i.e. comparing Raman measurements from women who have given birth to those who have never been pregnant, as well as variations in BMI have a significant effect on the dispersion of normal Raman spectra (in press). Studies are underway to see if accounting for these variations also leads to an increased rate of disease classification, similar to the results found with hormonal status and previous disease.
These slight variations have only been observed, accounted for, and incorporated into disease classification algorithms to increase sensitivity and specificity because of the increasingly sophisticated technology used in our system. Specifically, the fiber optic probe and the CCD camera are irreplaceable components that have dramatically increased the resolution of the system, enabling us to detect the small changes that are due to normal patient variations. Accounting for those changes allows the algorithm to focus on detecting the changes due to disease, resulting in higher disease classification rates.
Future Directions
While this note has focused on using Raman spectroscopy for detecting cervical dysplasia, Raman spectroscopy has also been utilized for detecting malignancies in other tissue sites, such as the breast, skin, colon and prostate, both by our research group and others. Also, Raman has been explored as a method for detecting endocrine glands, changes in the cervix indicative of labor, and inflammatory bowel disease. The fiber probe can be used alone, as described, or it can be inserted into clinical tools, such as an endoscope, to collect Raman data.
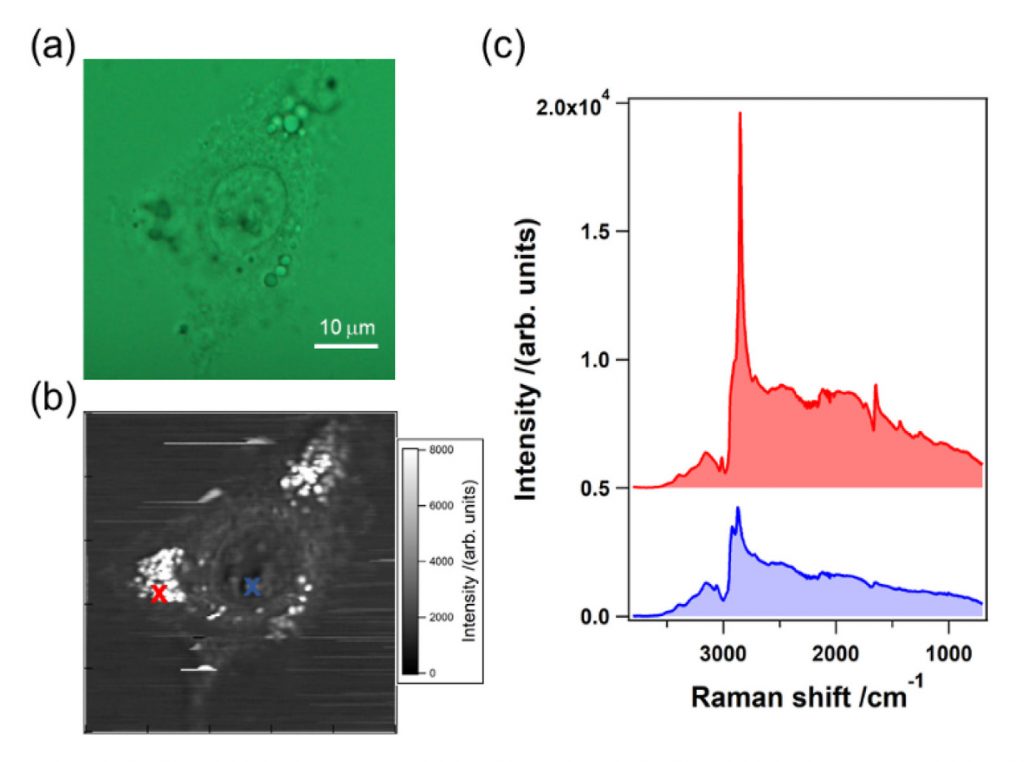
There are also many uses of Raman spectroscopy that move away from the conventional fiber optic probe. Spatially offset Raman spectroscopy (SORS) has been developed to interrogate deeper layers of tissue by separating the fibers within the probe. SORS has been used for bone applications and assessing tumor margins. Surface enhanced Raman spectroscopy (SERS) relies on an increase in Raman signal after a metal surface has been added, such as after gold nanoparticles are applied to a sample. This technique has been developed for in vivo use, as well as with Raman microscopy. Finally, Raman microscopy provides even higher resolution than what can be achieved with a probe-based system. Most of these systems cannot be used for in vivo diagnosis, however research into ways of combining the resolution of a microscope with the accuracy of Raman, such as confocal Raman spectroscopy, is currently underway.
Raman spectroscopy has the potential to assist in solving many problems facing the medical community. Using optimized equipment is essential to maximize the success of applying this technique for disease diagnosis. We believe that, as advances in technology continue, medical providers will move away from conventional techniques to optical methods such as Raman spectroscopy to deliver fast, accurate, non-invasive diagnoses.
About the Authors
Elizabeth Vargis, Ph.D.is a Biomedical Engineering Associate Professor at Utah State University (however contributed to this article during her Ph.D. at Vanderbilt University, Nashville, TN). She earned her B.S. in Bioengineering from the University of California, Berkeley and her M.S. and Ph.D. in Biomedical Engineering from Vanderbilt.
Anita Mahadevan-Jansen, Ph.D., is the Orrin H. Ingram Professor of Biomedical Engineering and Professor of Neurological Surgery at Vanderbilt University, Nashville, TN. She earned her B.S. and M.S. in Physics from the University of Bombay and her M.S. and Ph.D. in Biomedical Engineering from the University of Texas @ Austin.
Literature Cited
1 Pavlova, I. et al. Microanatomical and biochemical origins of normal and precancerous cervical autofluorescence using laser-scanning fluorescence confocal microscopy. Photochem Photobiol 77, 550-5 (2003).
Further Reading
Introduction to Raman Spectroscopy
Introduction into how Raman spectroscopy occurs, what it can be used to measure, and how it can be used within internal and environmental sensing
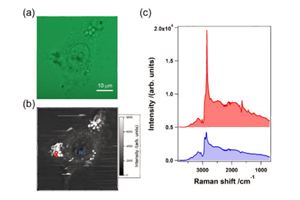
Ultra-Multiplex CARS Spectroscopic Imaging of Living Cells
Ultra-multiplex CARS spectroscopic imaging is able to provide non-invasive, real-time, cellular-level molecular diagnostics for both experimental and clinical applications.
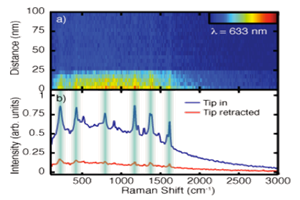
Tip-Enhanced Raman Spectroscopy
Article describing the fundamentals of tip-enhanced Raman spectroscopy and the investigations of researchers from the University of Colorado at Boulder.